 6
6peptides
spectra
0.000 | 0.000
0.000 | 0.000
0.000 | 0.000
0.404 | 0.564
0.024 | 0.206
0.000 | 0.000
0.361 | 0.407
0.000 | 0.000
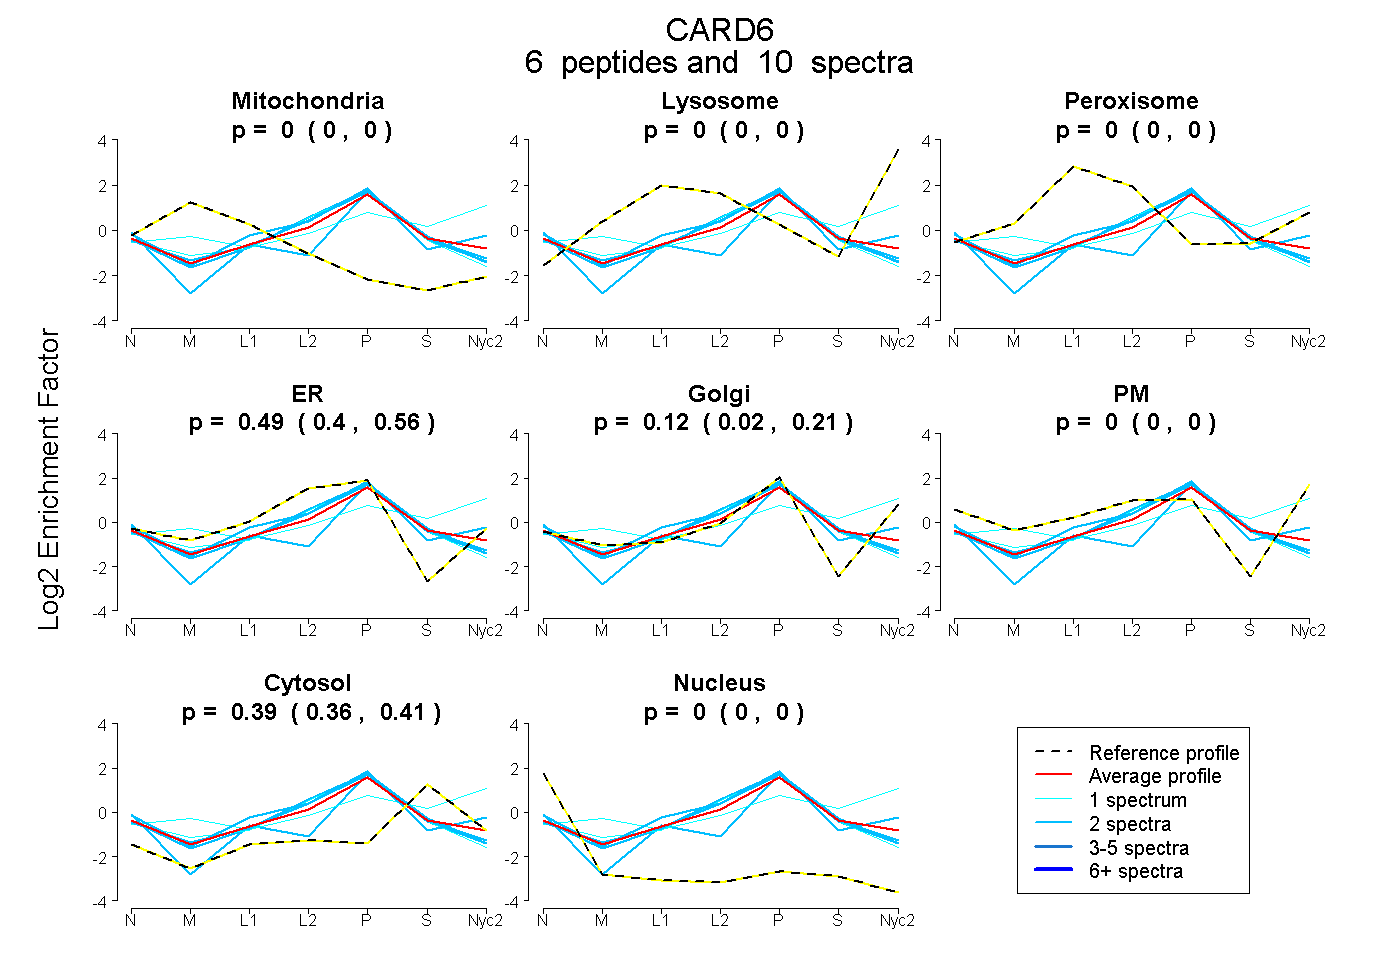
| Plot | Mito | Lyso | Perox | ER | Golgi | PM | Cytosol | Nucleus | |||||
| Expt A |
6 peptides |
10 spectra |
|
0.000 0.000 | 0.000 |
0.000 0.000 | 0.000 |
0.000 0.000 | 0.000 |
0.492 0.404 | 0.564 |
0.122 0.024 | 0.206 |
0.000 0.000 | 0.000 |
0.386 0.361 | 0.407 |
0.000 0.000 | 0.000 |
| 2 spectra, YFQPWR | 0.000 | 0.000 | 0.006 | 0.496 | 0.241 | 0.000 | 0.257 | 0.000 | ||
| 2 spectra, QPSAQSSGGPLR | 0.000 | 0.000 | 0.000 | 0.620 | 0.000 | 0.000 | 0.380 | 0.000 | ||
| 1 spectrum, IIPTSHQEAQR | 0.000 | 0.237 | 0.000 | 0.000 | 0.297 | 0.095 | 0.371 | 0.000 | ||
| 2 spectra, LKPSQLLFWEAEEAGDR | 0.000 | 0.000 | 0.000 | 0.627 | 0.000 | 0.000 | 0.373 | 0.000 | ||
| 2 spectra, GAQQVTAPR | 0.000 | 0.000 | 0.000 | 0.206 | 0.285 | 0.000 | 0.424 | 0.086 | ||
| 1 spectrum, MPVISFVR | 0.000 | 0.000 | 0.000 | 0.634 | 0.000 | 0.000 | 0.366 | 0.000 |
| Plot | Lyso | Other | |||||||||||
| Expt C |
5 peptides |
10 spectra |
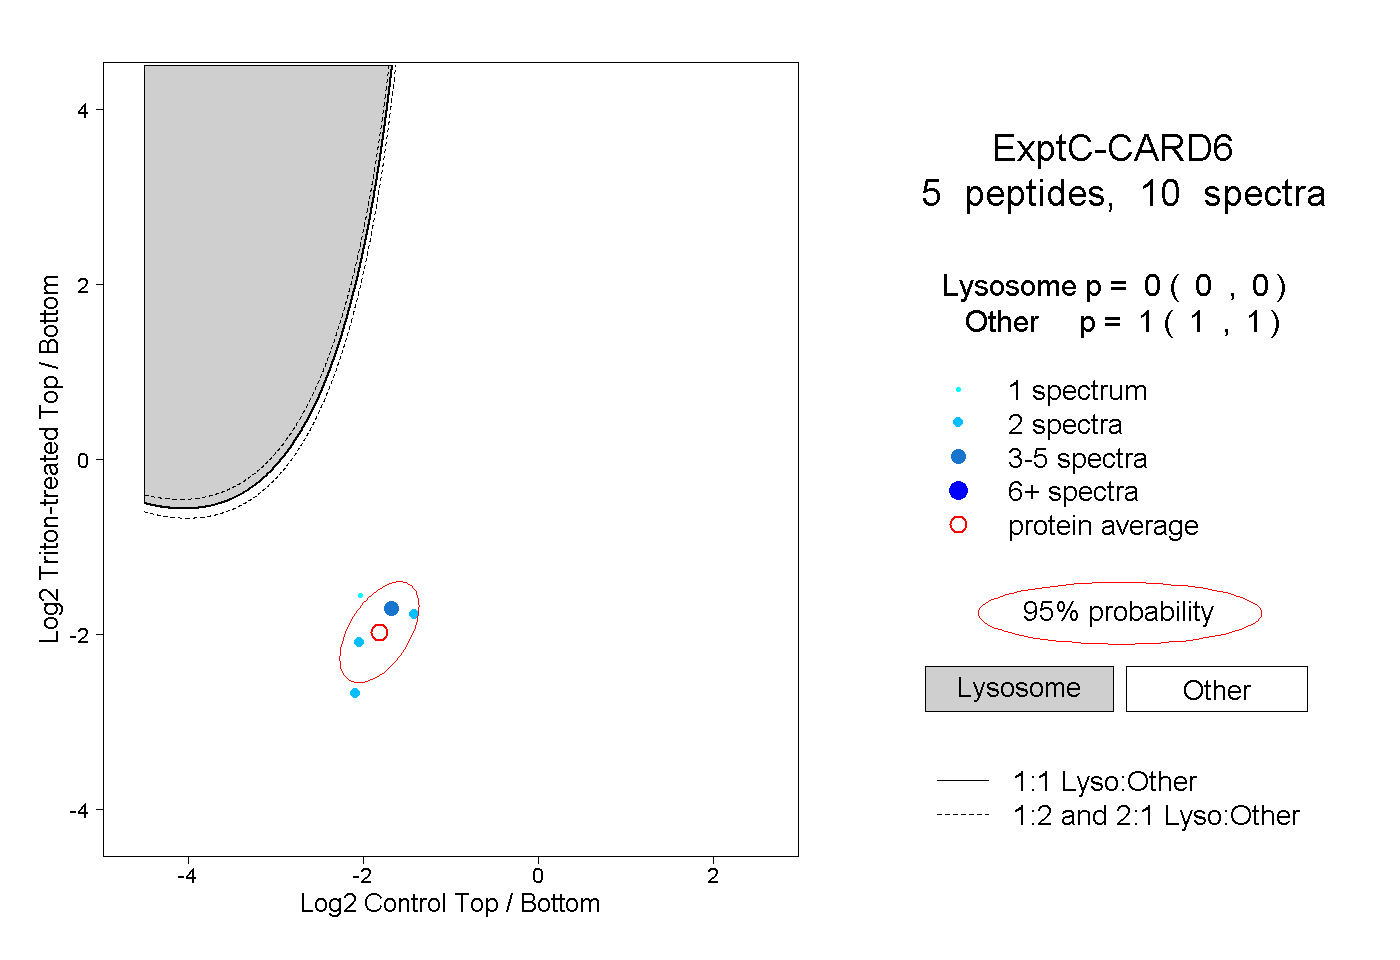 |
0.000 0.000 | 0.000 |
1.000 1.000 | 1.000 |
||||||||
| Plot | Lyso | Other | |||||||||||
| Expt D |
2 peptides |
2 spectra |
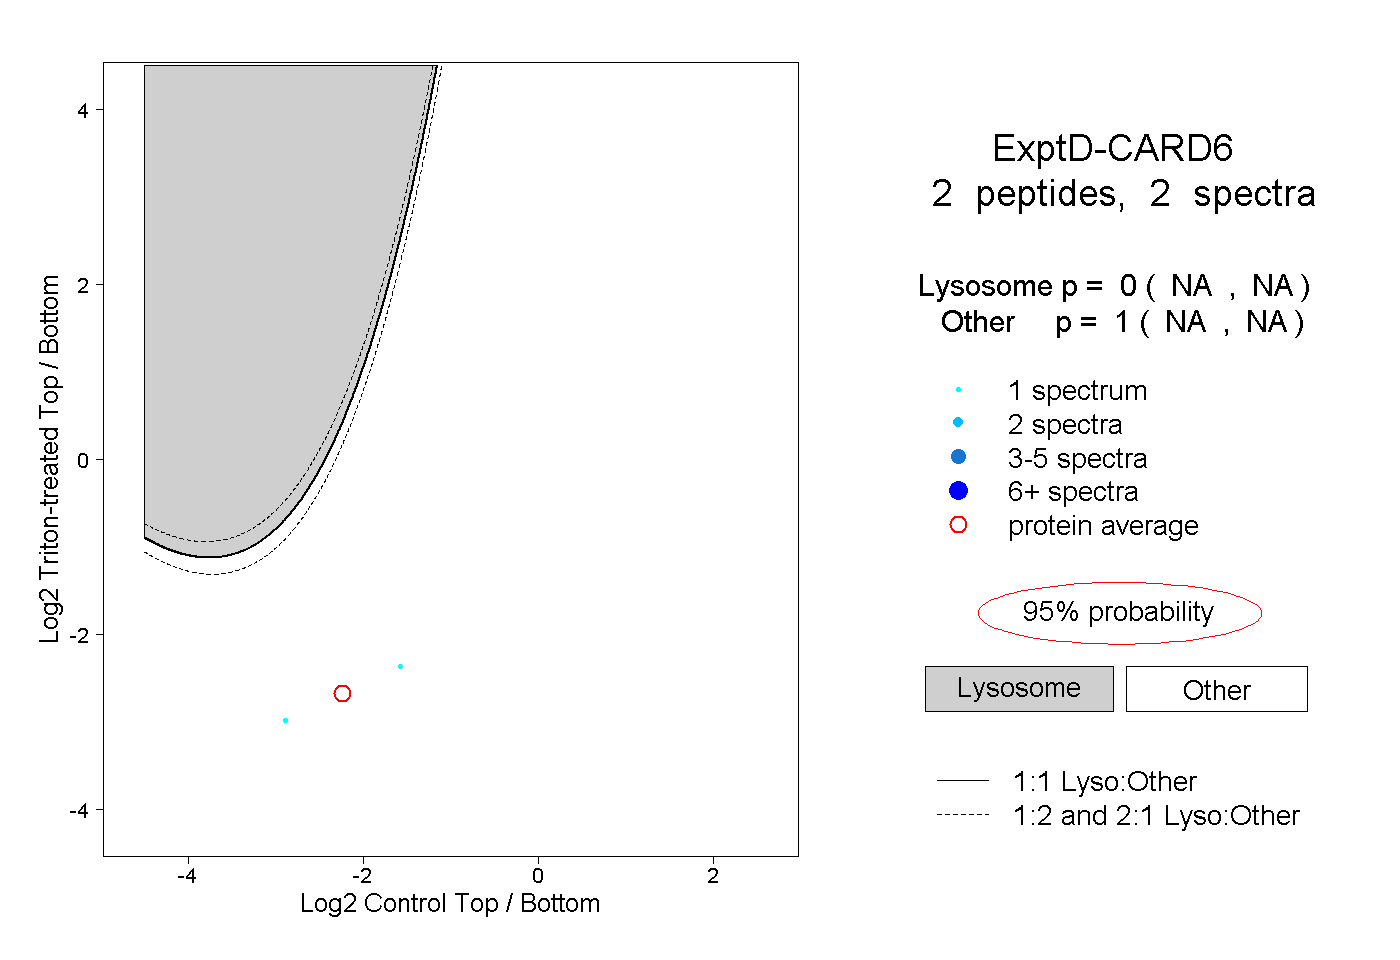 |
0.000 NA | NA |
1.000 NA | NA |