 3
3peptides
spectra
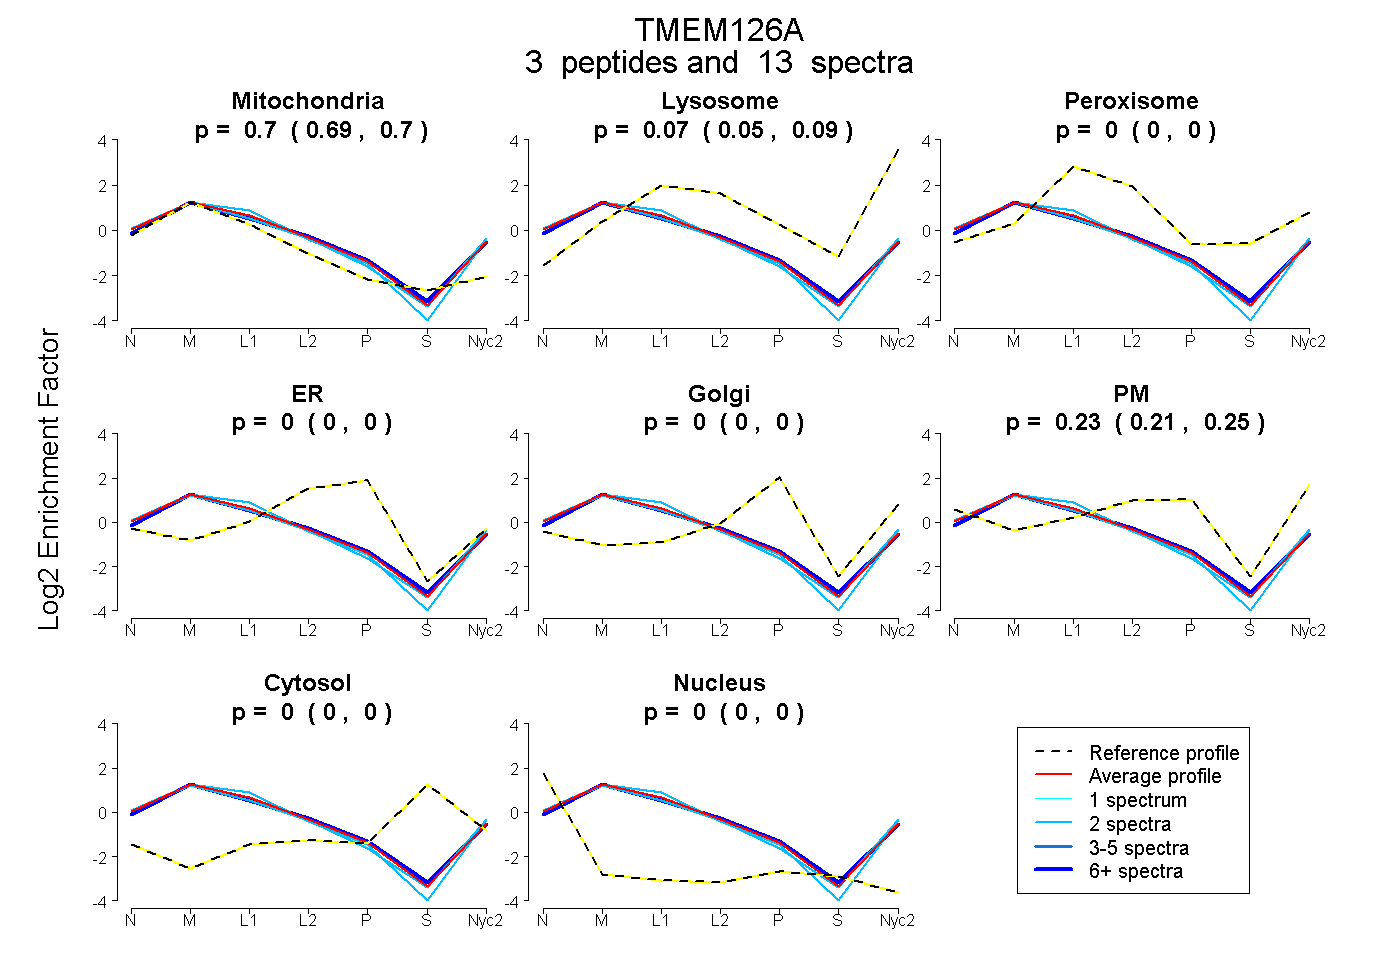
0.687 | 0.704
0.054 | 0.089
0.000 | 0.000
0.000 | 0.000
0.000 | 0.000
0.207 | 0.250
0.000 | 0.000
0.000 | 0.000
1peptide
spectra
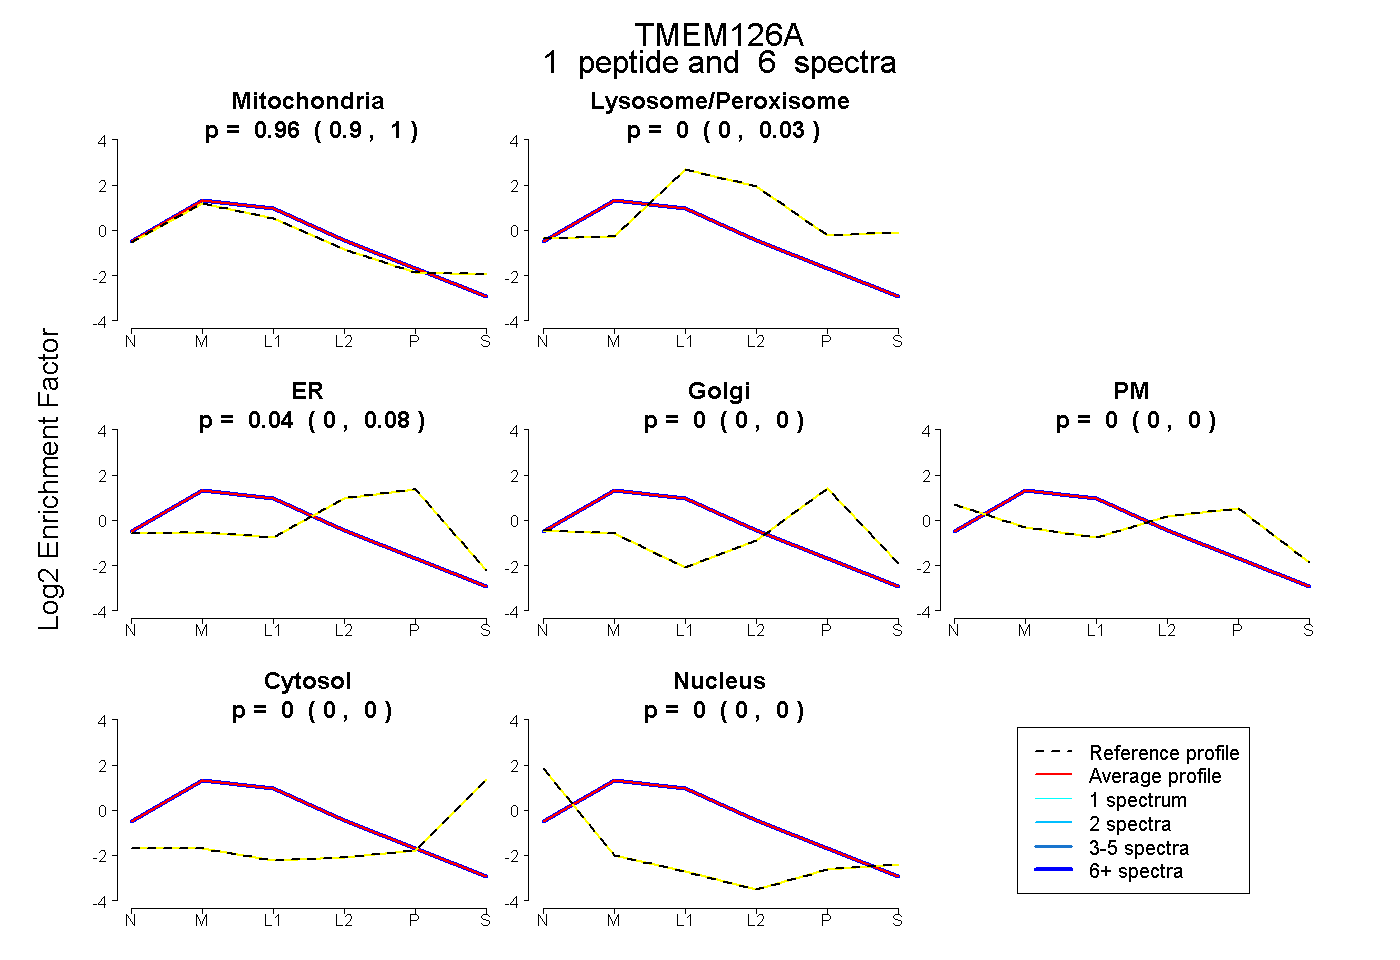
0.905 | 0.996
0.000 | 0.030
0.000 | 0.079
0.000 | 0.000
0.000 | 0.000
0.000 | 0.000
0.000 | 0.000
5peptides
spectra
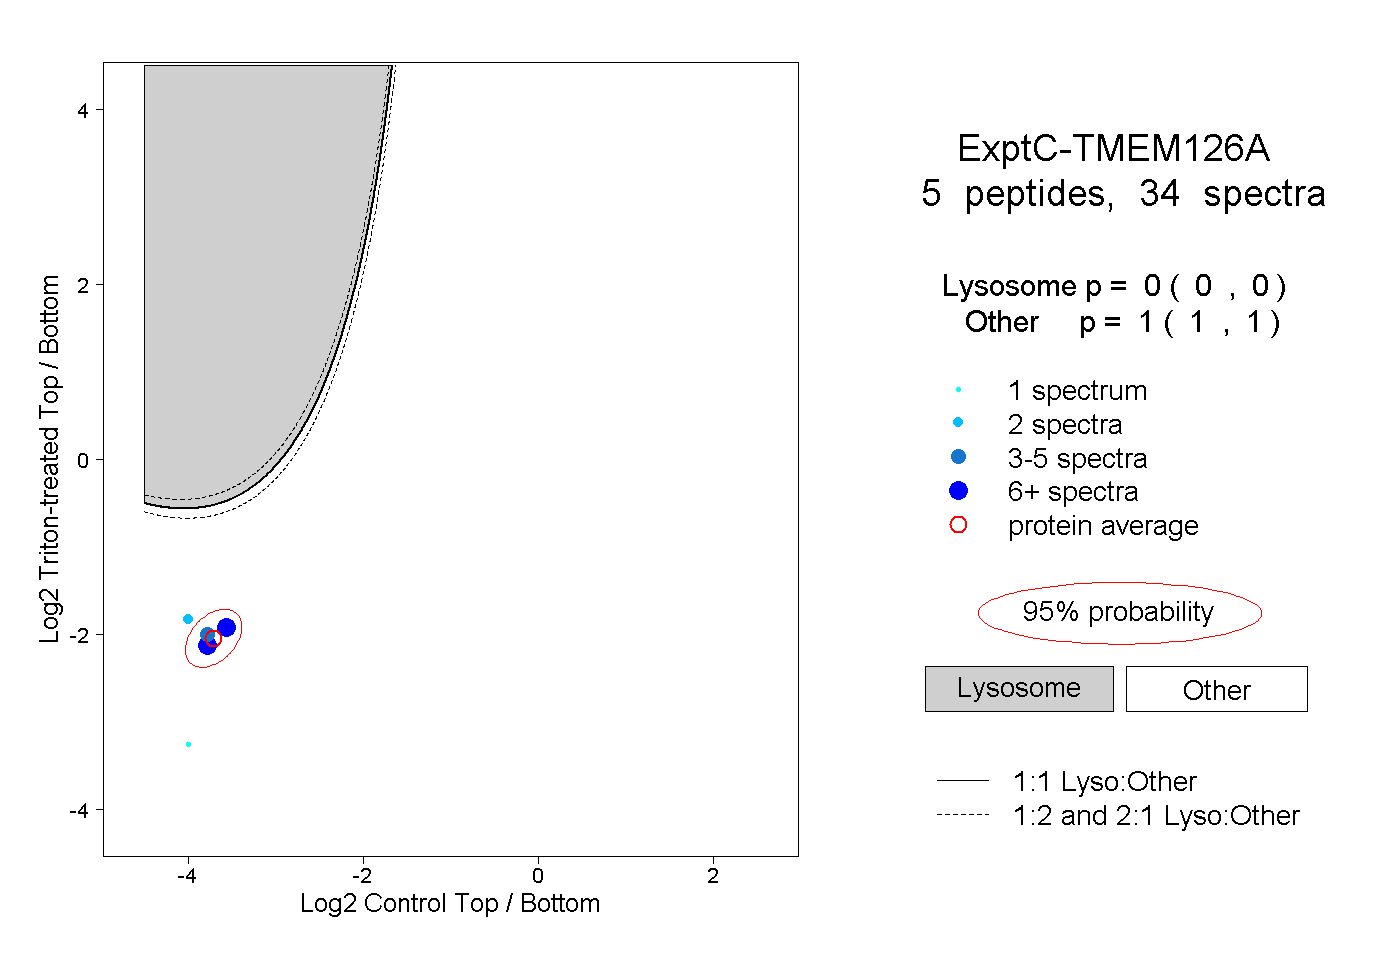
0.000 | 0.000
1.000 | 1.000
2peptides
spectra
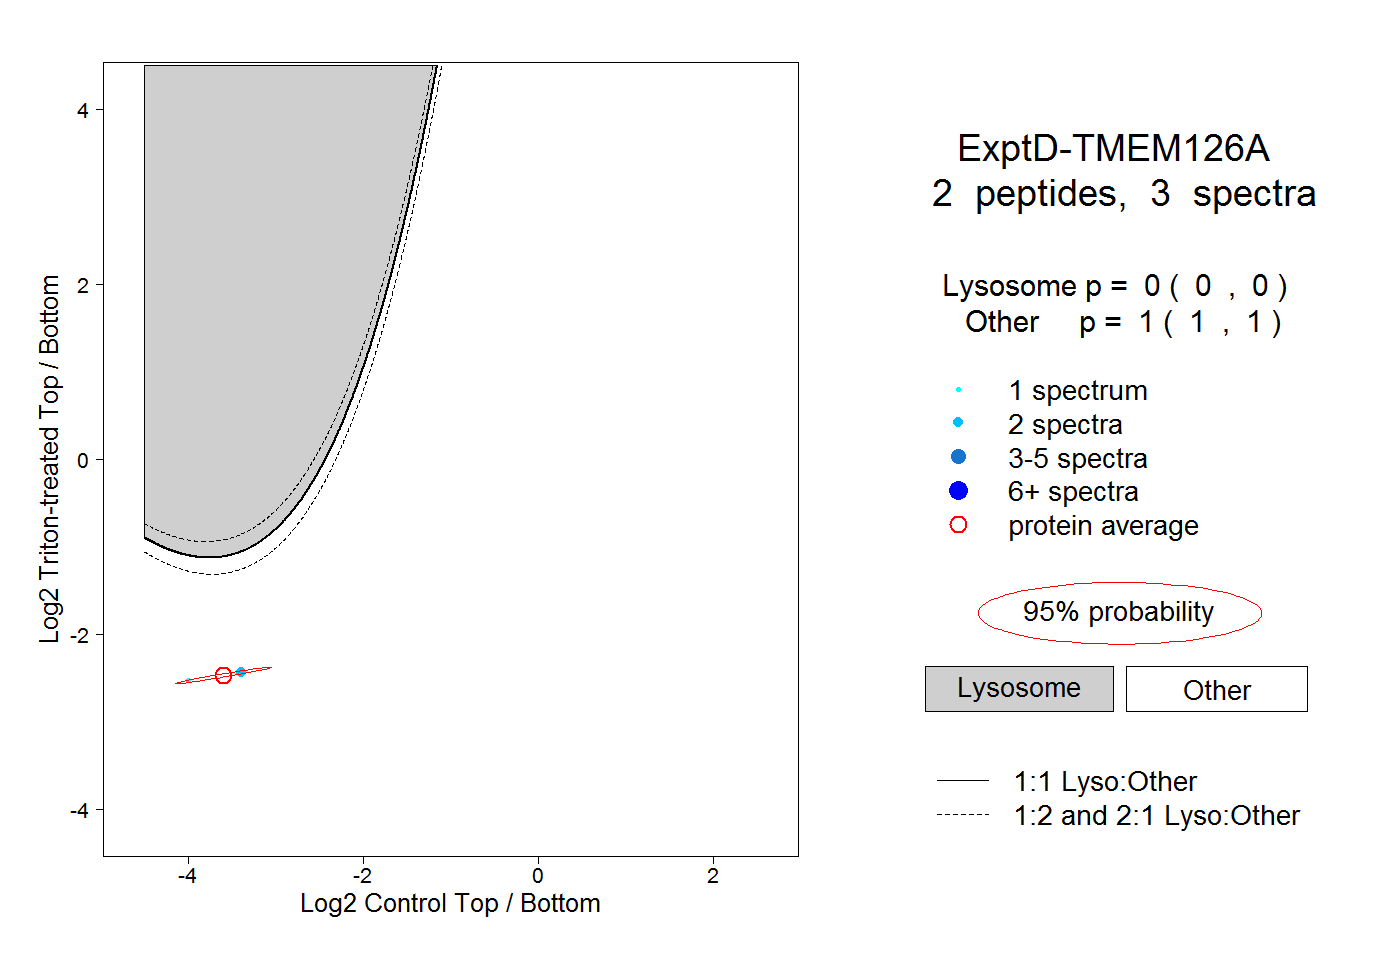
0.000 | 0.000
1.000 | 1.000