 36
36peptides
spectra
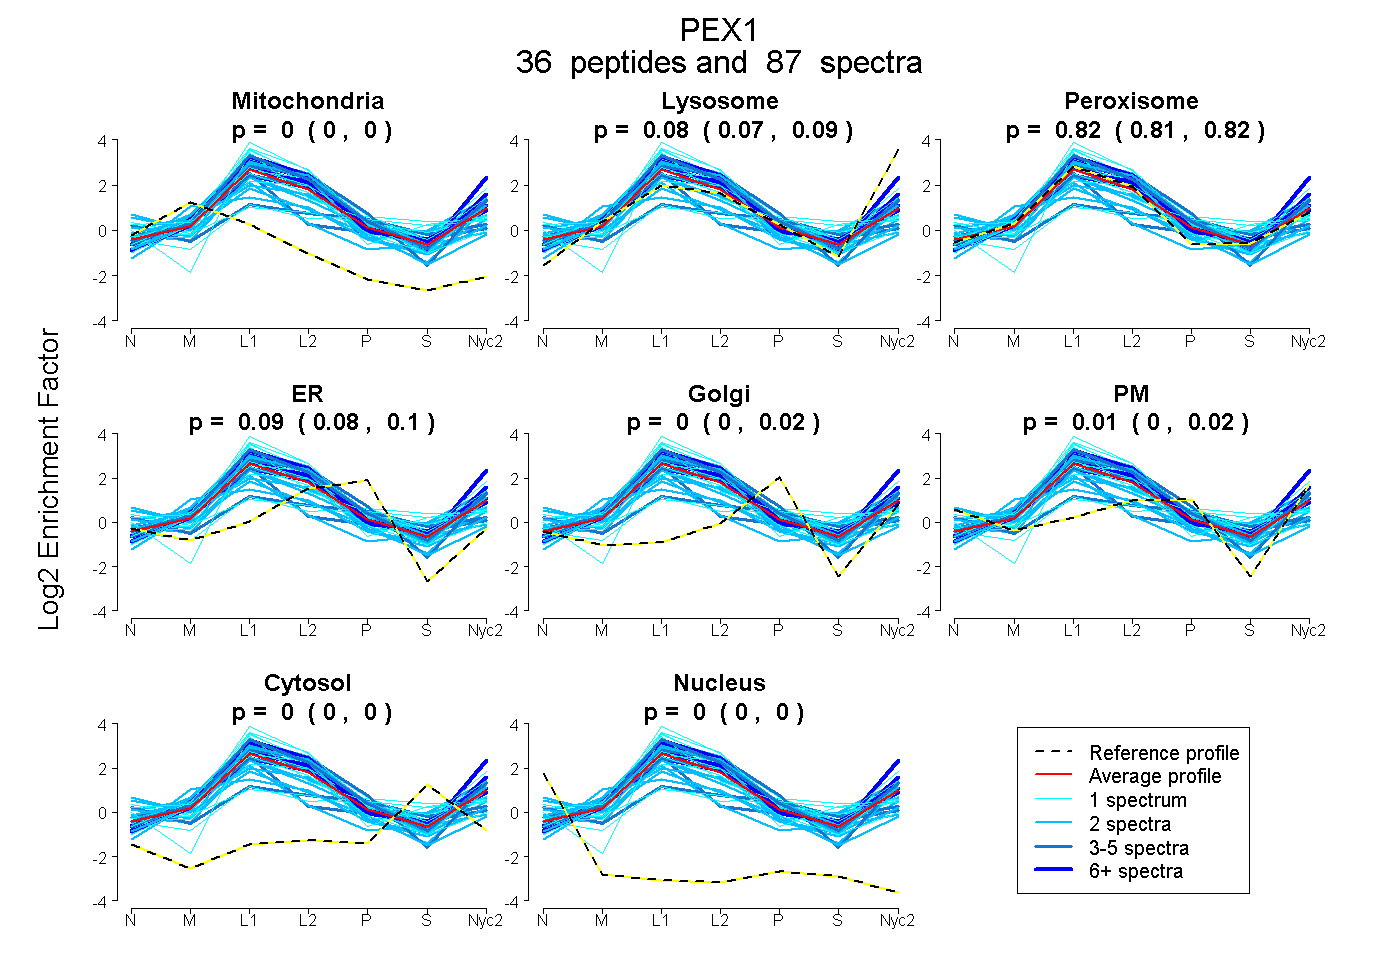
0.000 | 0.000
0.074 | 0.088
0.808 | 0.823
0.078 | 0.101
0.000 | 0.015
0.000 | 0.016
0.000 | 0.000
0.000 | 0.000
22peptides
spectra
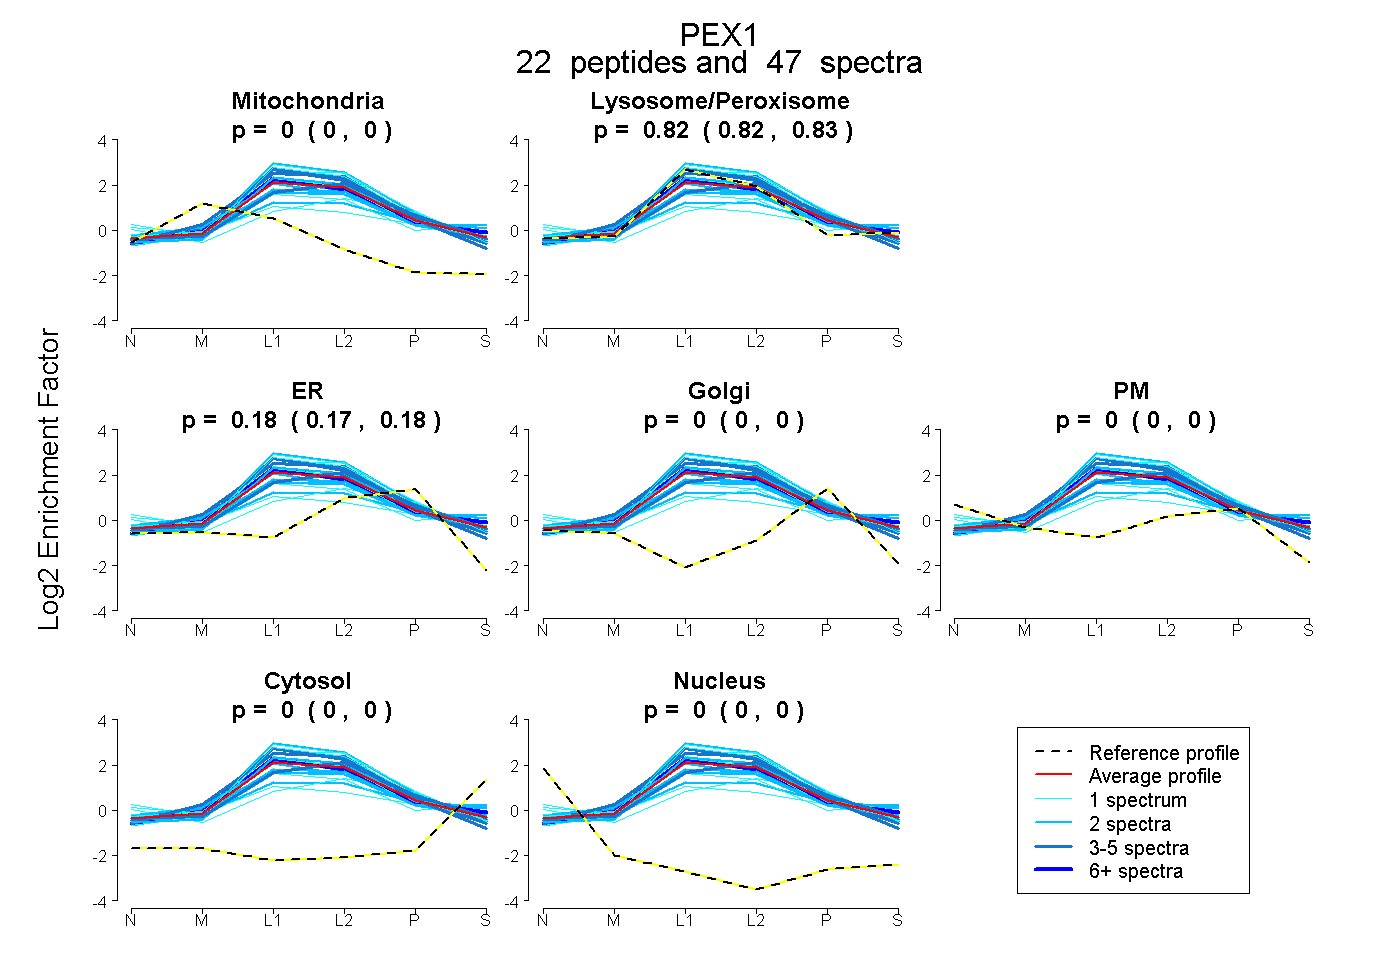
0.000 | 0.000
0.819 | 0.831
0.168 | 0.180
0.000 | 0.000
0.000 | 0.000
0.000 | 0.000
0.000 | 0.000
47peptides
spectra
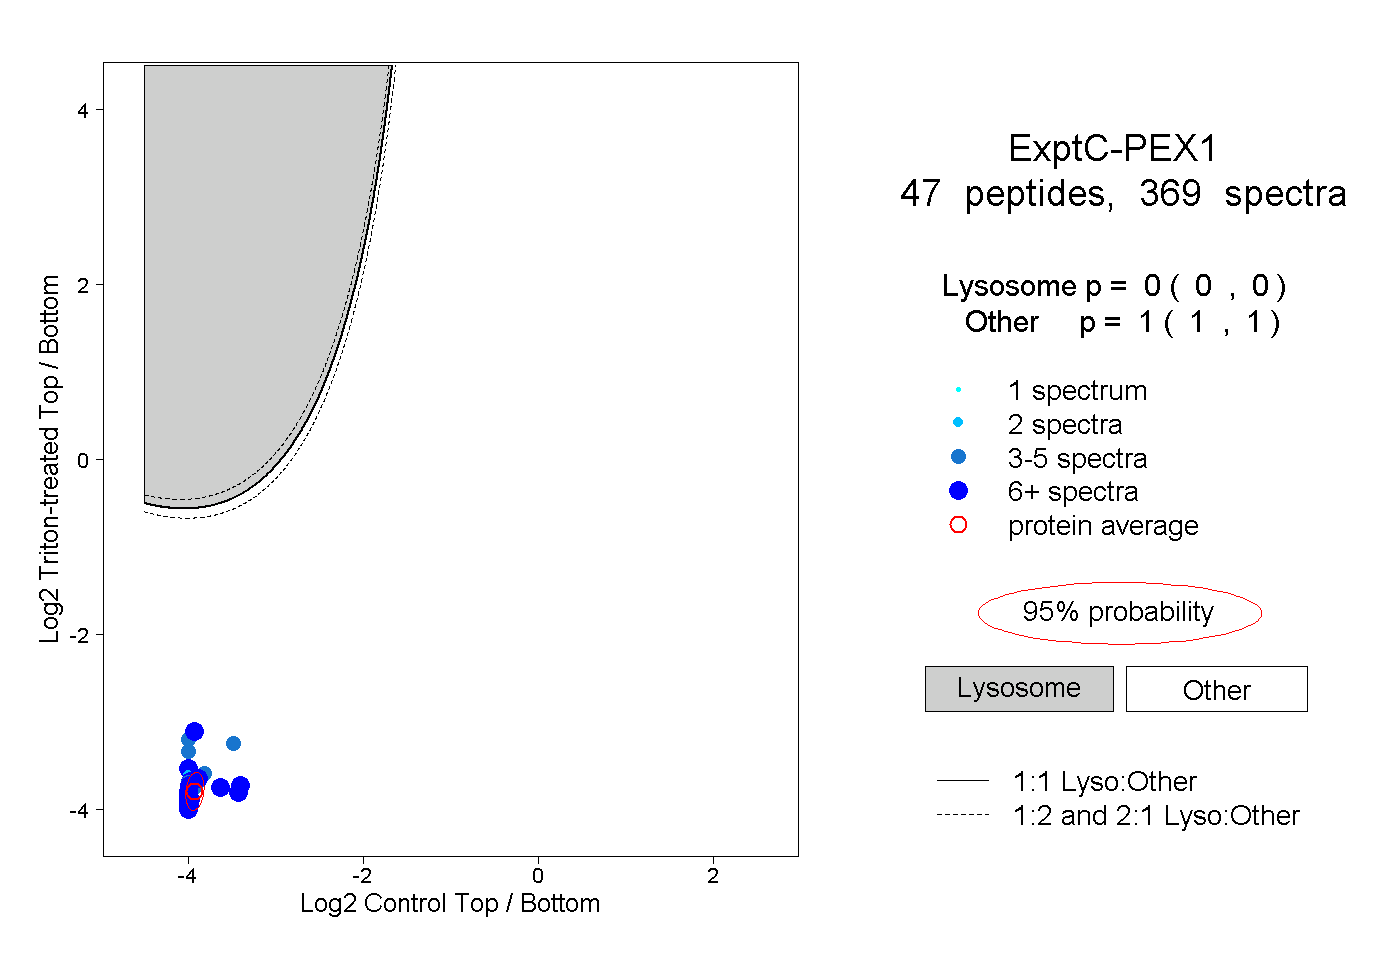
0.000 | 0.000
1.000 | 1.000
16peptides
spectra
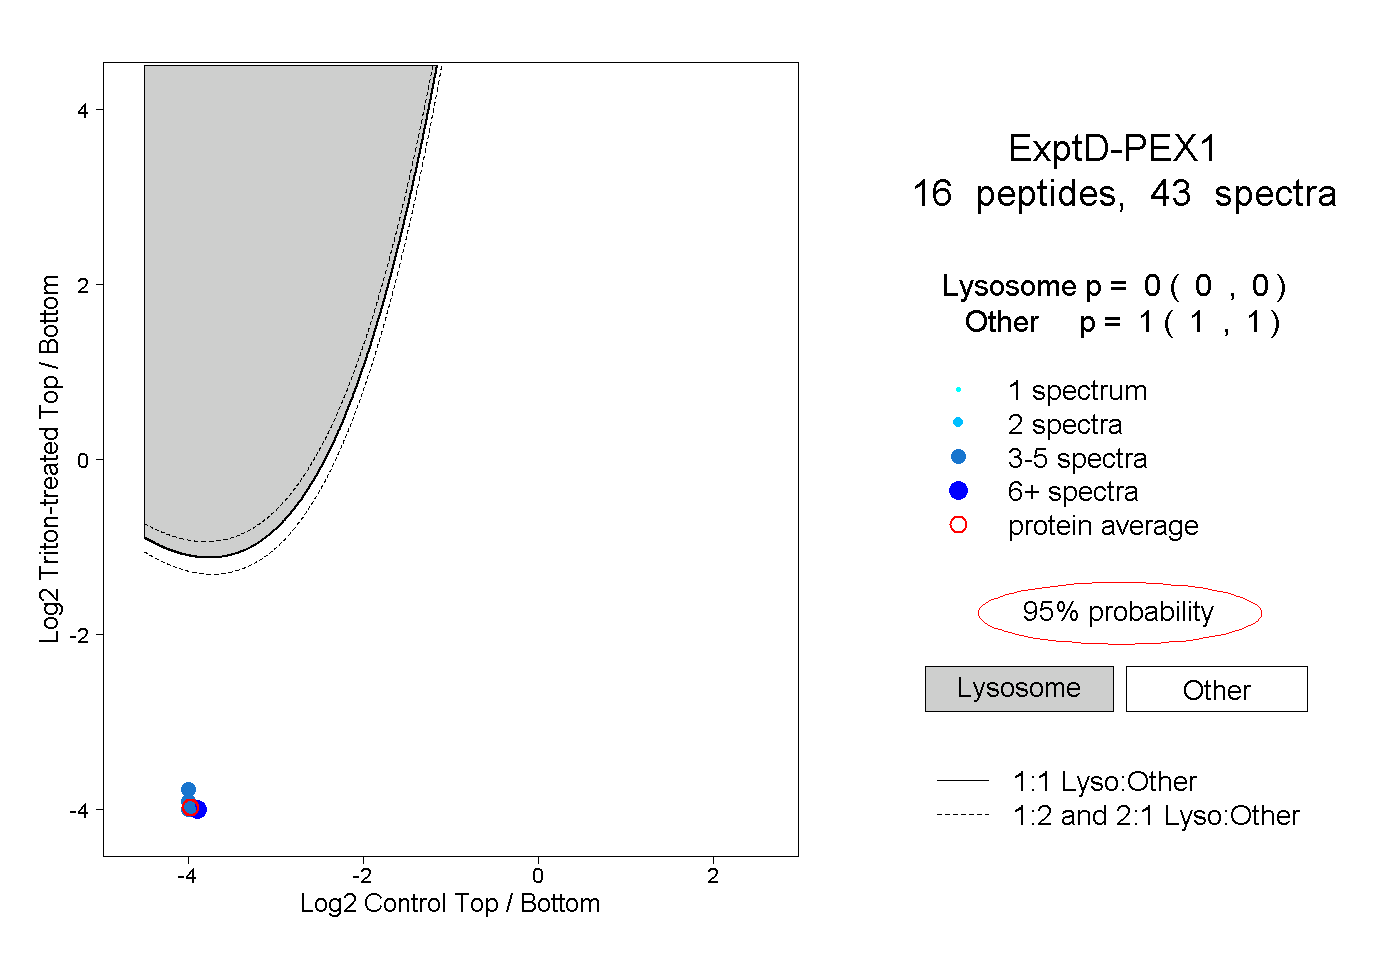
0.000 | 0.000
1.000 | 1.000