 1
1peptide
spectra
0.000 | 0.000
0.853 | 0.904
0.000 | 0.000
0.000 | 0.000
0.000 | 0.000
0.000 | 0.000
0.091 | 0.143
0.000 | 0.000
5peptides
spectra
0.040 | 1.000
0.000 | 0.954
| Plot | Mito | Lyso | Perox | ER | Golgi | PM | Cytosol | Nucleus | |||||
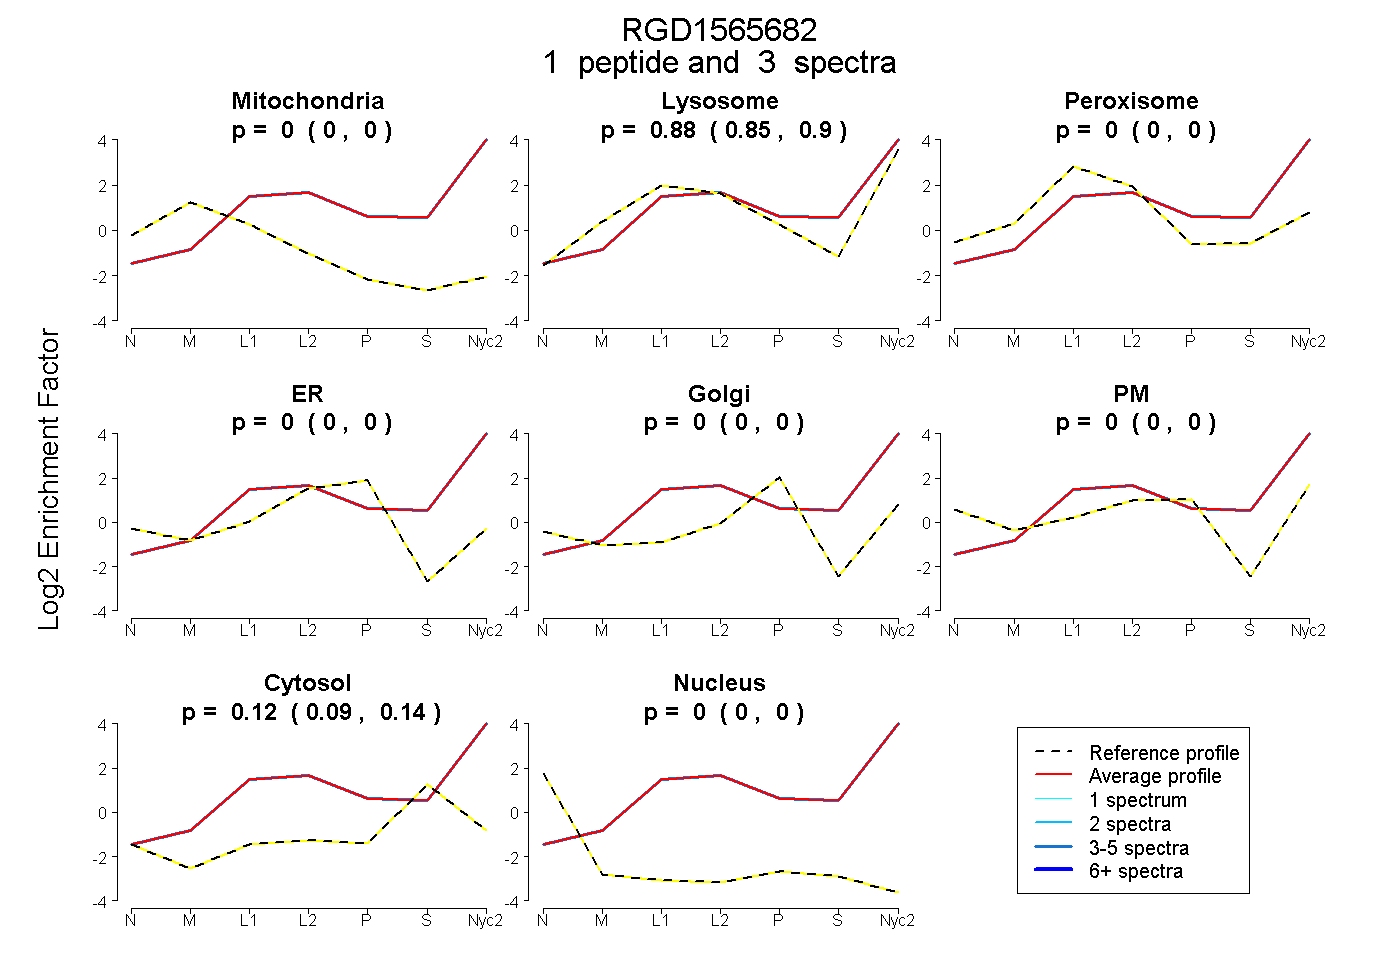
| Expt A |
1 peptide |
3 spectra |
|
0.000 0.000 | 0.000 |
0.881 0.853 | 0.904 |
0.000 0.000 | 0.000 |
0.000 0.000 | 0.000 |
0.000 0.000 | 0.000 |
0.000 0.000 | 0.000 |
0.119 0.091 | 0.143 |
0.000 0.000 | 0.000 |
||
| Plot | Lyso | Other | |||||||||||
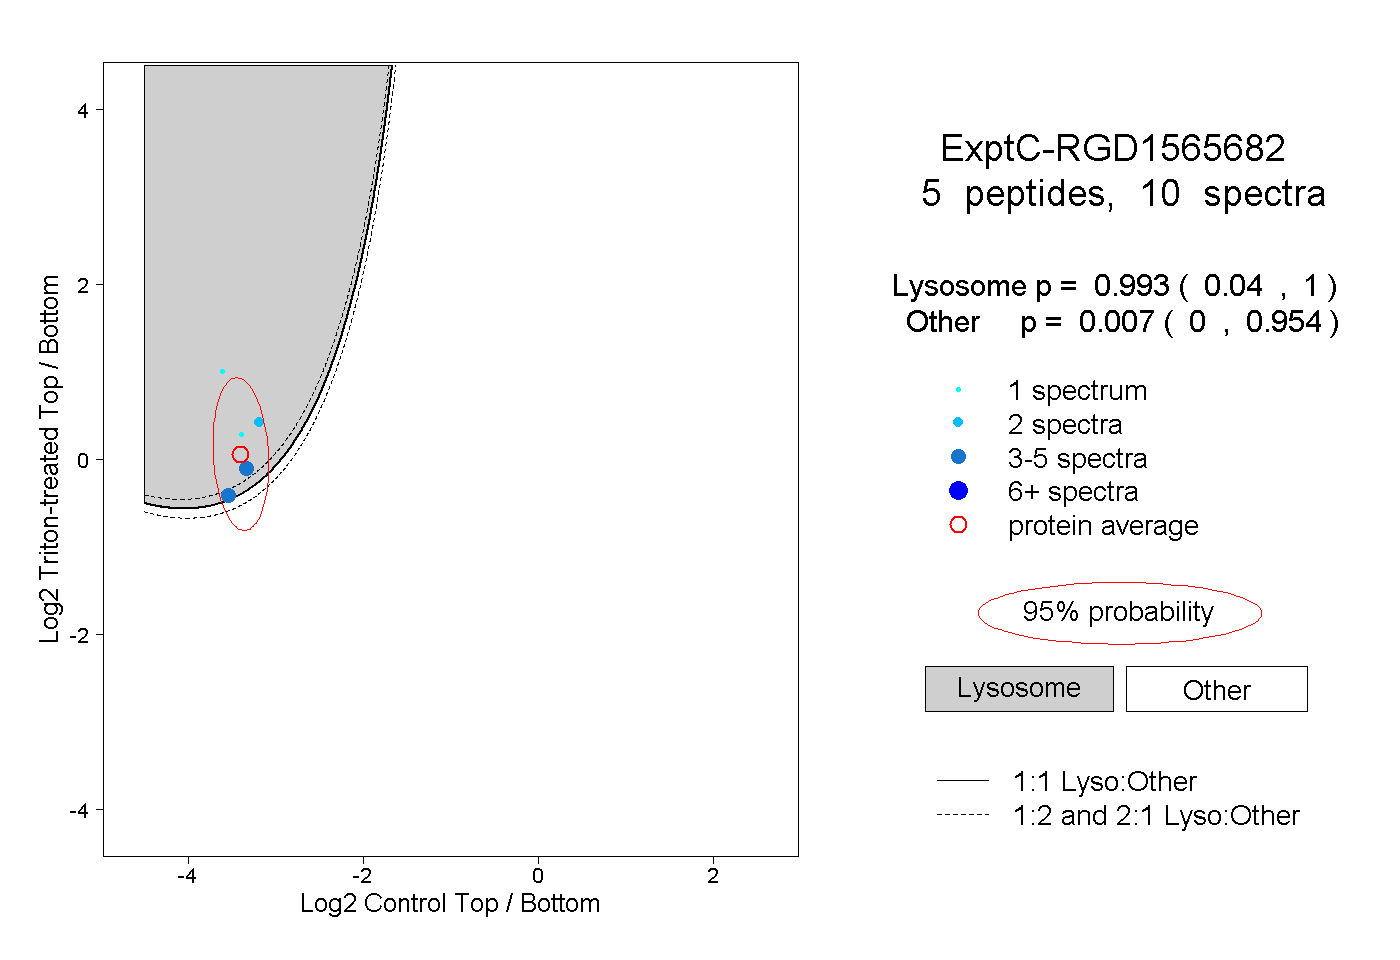
| Expt C |
5 peptides |
10 spectra |
|
0.993 0.040 | 1.000 |
0.007 0.000 | 0.954 |
| 3 spectra, IFNLIYHK | 0.939 | 0.061 | ||||||||
| 3 spectra, DVANLVPK | 0.657 | 0.343 | ||||||||
| 2 spectra, GSTWAK | 0.999 | 0.001 | ||||||||
| 1 spectrum, LVFGK | 0.999 | 0.001 | ||||||||
| 1 spectrum, DFLADPK | 1.000 | 0.000 |