 5
5peptides
spectra
0.000 | 0.000
0.581 | 0.663
0.000 | 0.000
0.000 | 0.000
0.125 | 0.237
0.000 | 0.124
0.106 | 0.165
0.000 | 0.000
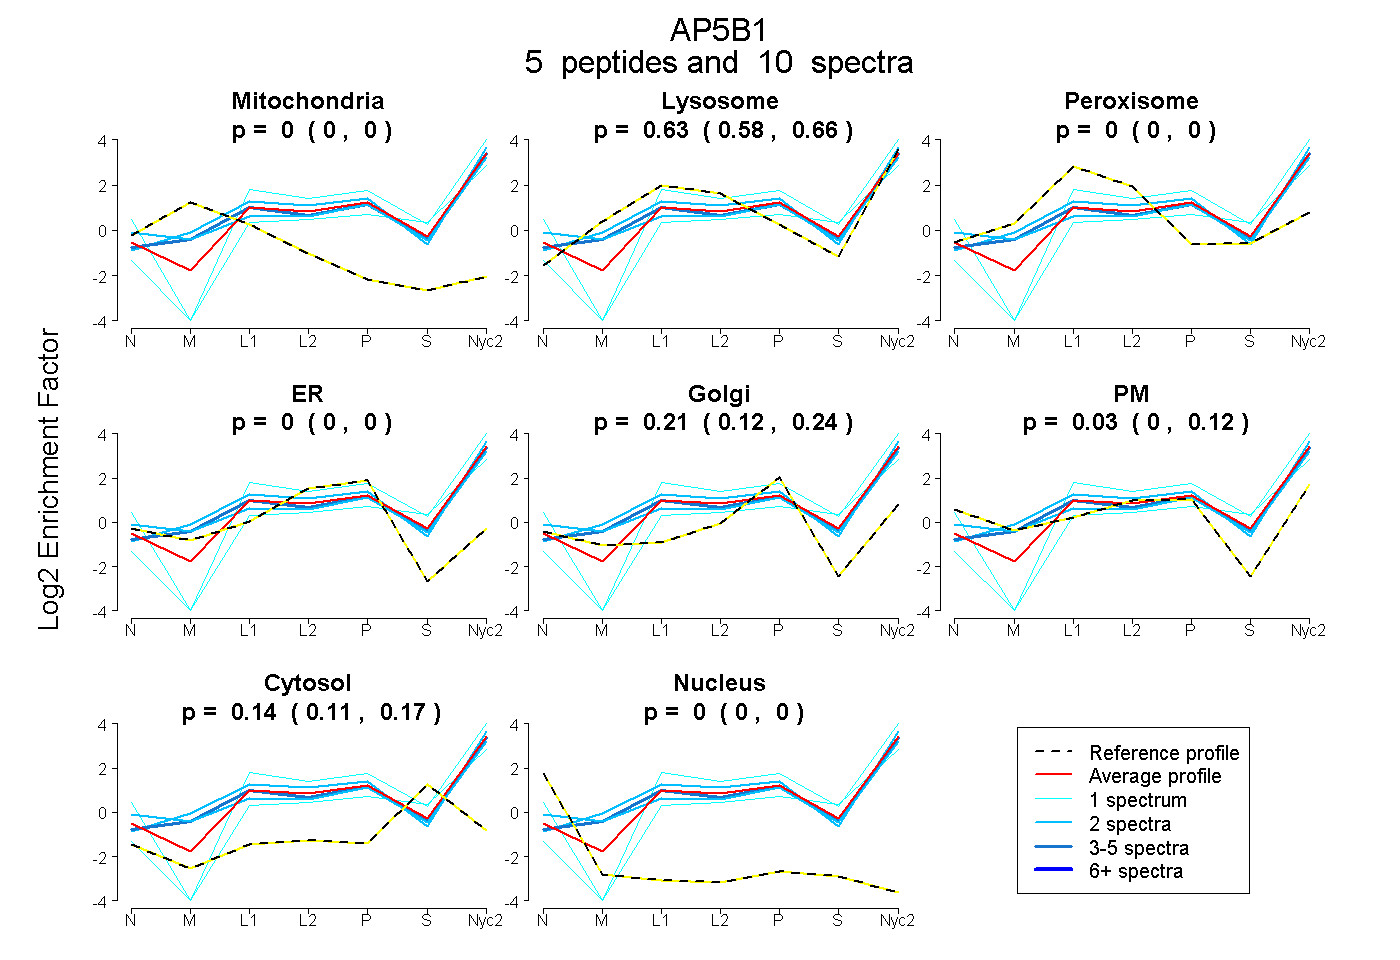
| Plot | Mito | Lyso | Perox | ER | Golgi | PM | Cytosol | Nucleus | |||||
| Expt A |
5 peptides |
10 spectra |
|
0.000 0.000 | 0.000 |
0.631 0.581 | 0.663 |
0.000 0.000 | 0.000 |
0.000 0.000 | 0.000 |
0.207 0.125 | 0.237 |
0.026 0.000 | 0.124 |
0.137 0.106 | 0.165 |
0.000 0.000 | 0.000 |
| 2 spectra, GQPPVLFKPQLVR | 0.000 | 0.799 | 0.000 | 0.000 | 0.201 | 0.000 | 0.000 | 0.000 | ||
| 4 spectra, LPPHSMLLLR | 0.000 | 0.714 | 0.000 | 0.000 | 0.201 | 0.000 | 0.085 | 0.000 | ||
| 1 spectrum, ASPSAFLAGAEGEDLGHDLLSDLR | 0.000 | 0.721 | 0.000 | 0.000 | 0.080 | 0.000 | 0.198 | 0.000 | ||
| 2 spectra, SFGTTSEQR | 0.000 | 0.516 | 0.000 | 0.000 | 0.079 | 0.304 | 0.101 | 0.000 | ||
| 1 spectrum, DFPILDPNPEDTR | 0.000 | 0.227 | 0.000 | 0.000 | 0.000 | 0.368 | 0.405 | 0.000 |
| Plot | Lyso | Other | |||||||||||
| Expt C |
5 peptides |
10 spectra |
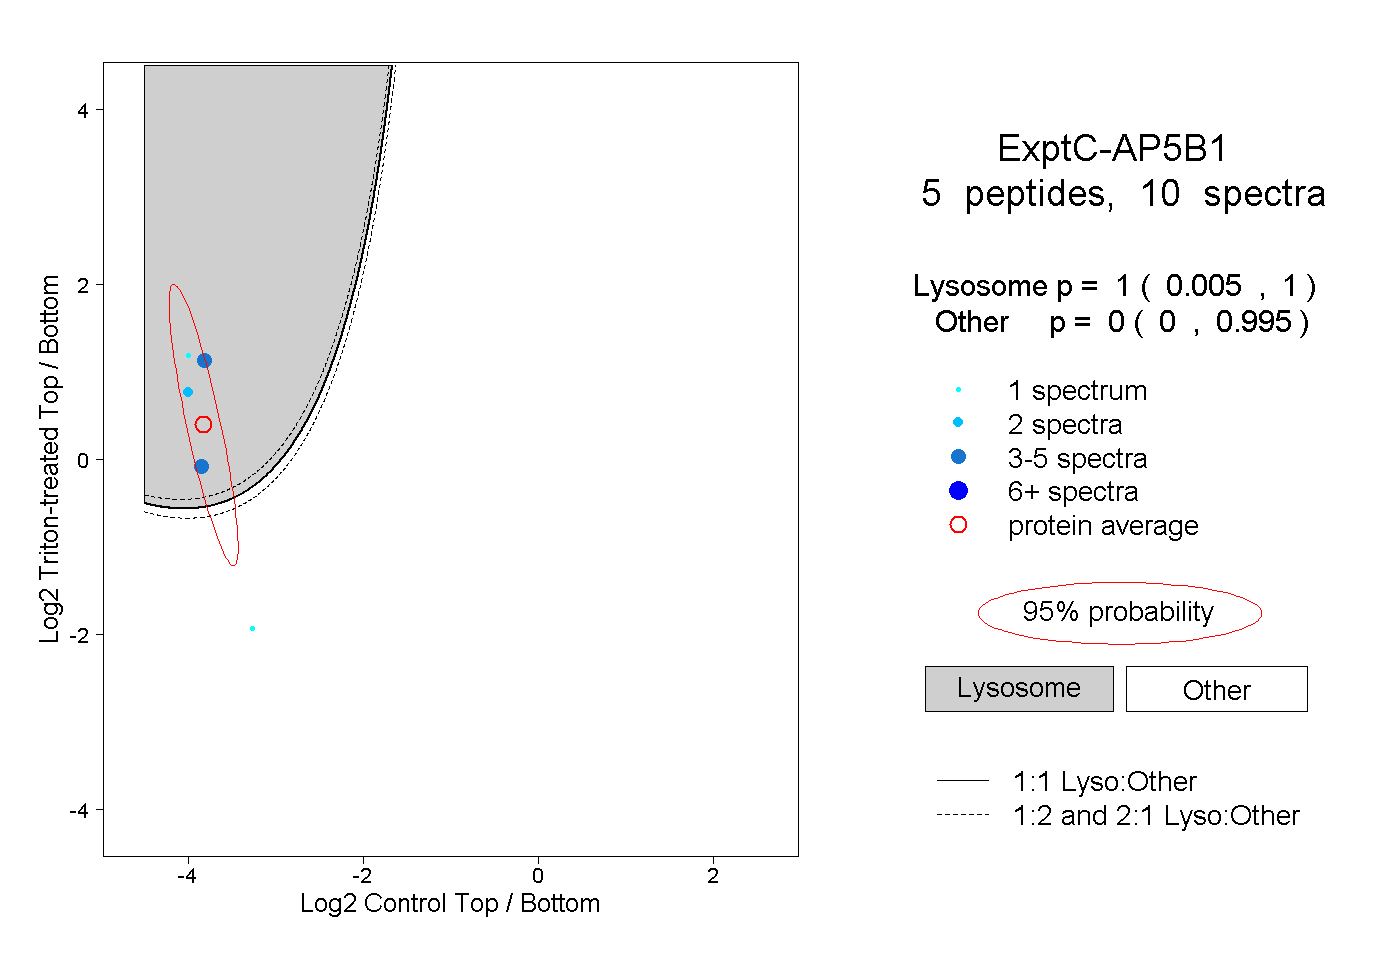 |
1.000 0.005 | 1.000 |
0.000 0.000 | 0.995 |
||||||||
| Plot | Lyso | Other | |||||||||||
| Expt D |
1 peptide |
3 spectra |
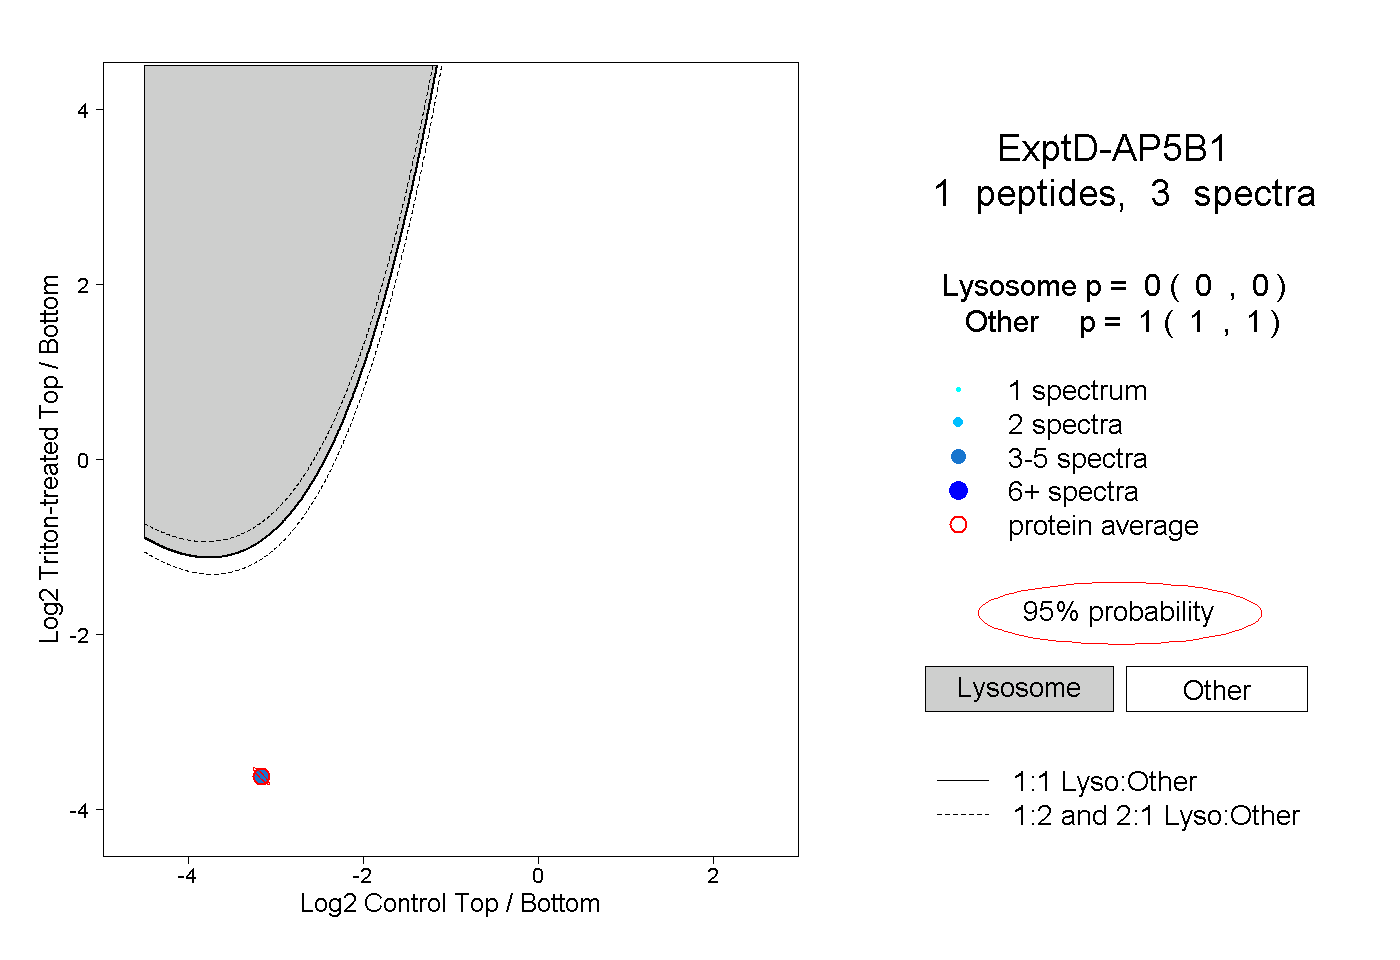 |
0.000 0.000 | 0.000 |
1.000 1.000 | 1.000 |