 5
5peptides
spectra
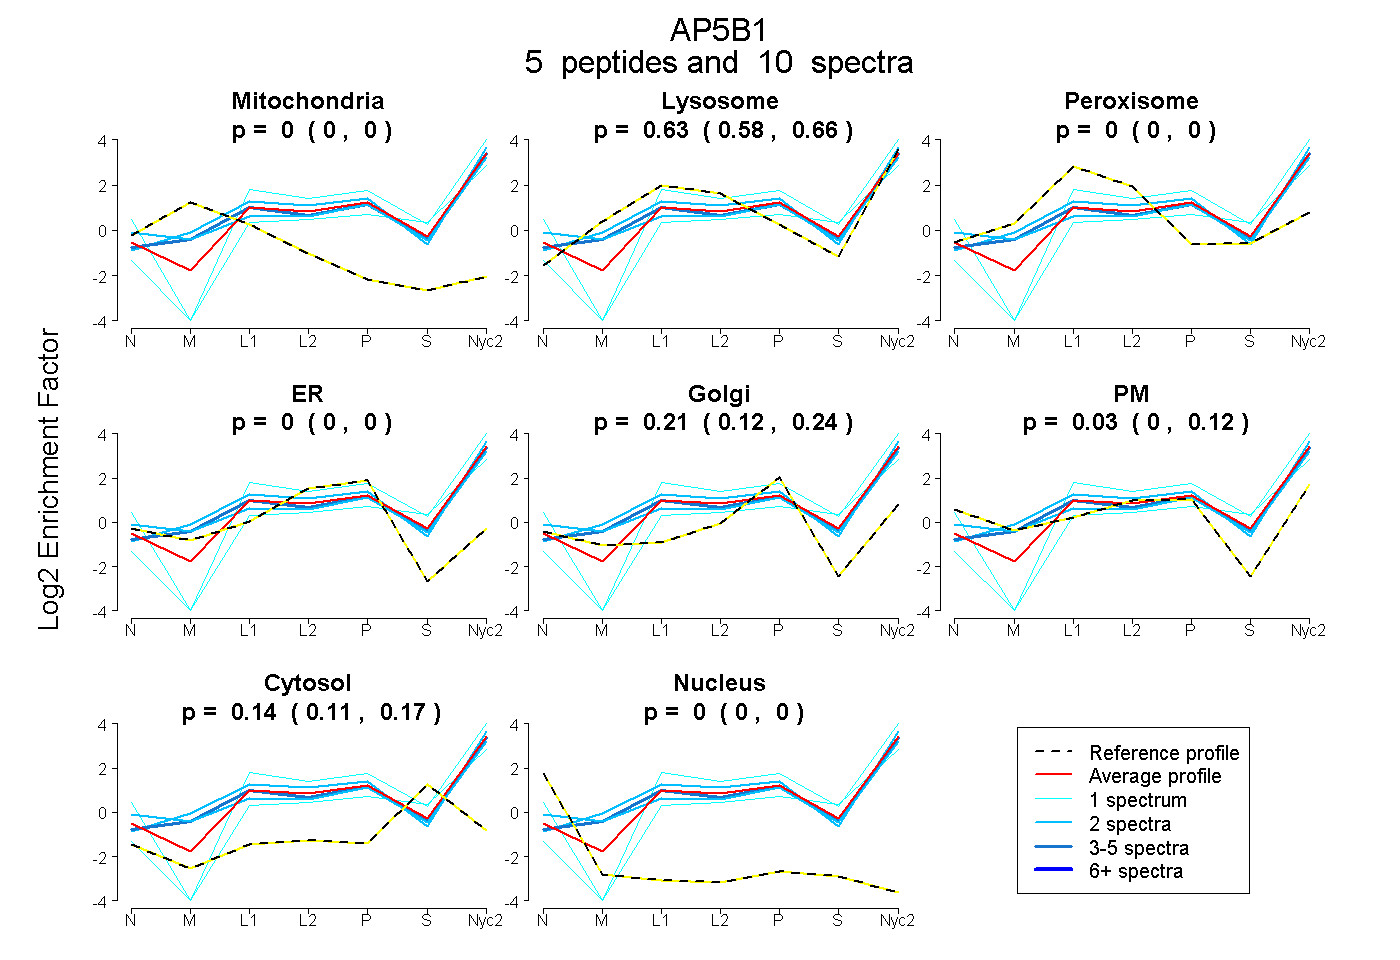
0.000 | 0.000
0.581 | 0.663
0.000 | 0.000
0.000 | 0.000
0.125 | 0.237
0.000 | 0.124
0.106 | 0.165
0.000 | 0.000
5peptides
spectra
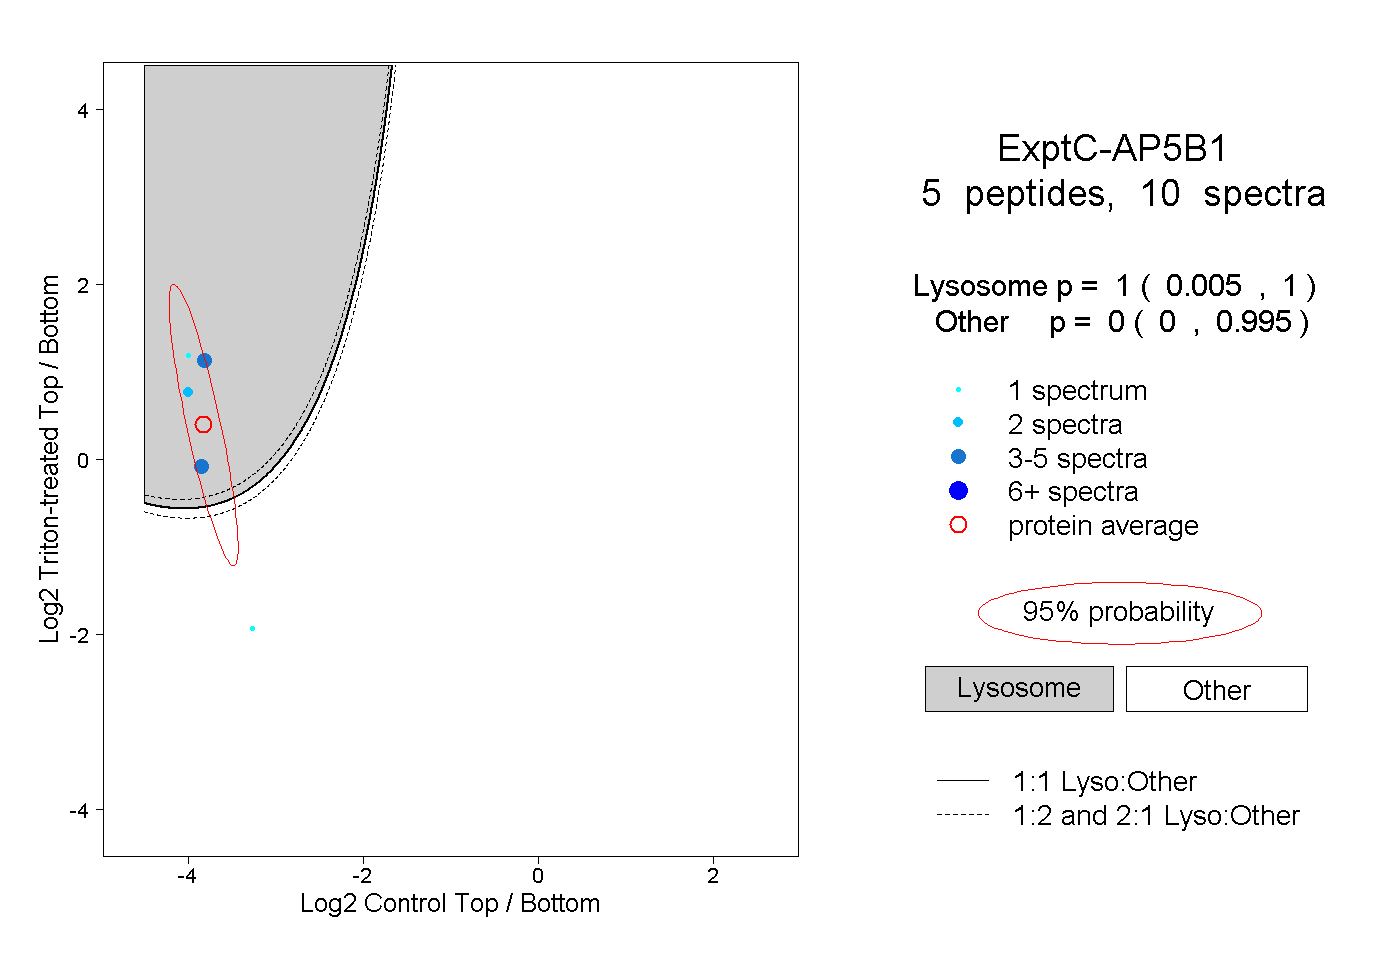
0.005 | 1.000
0.000 | 0.995
1peptide
spectra
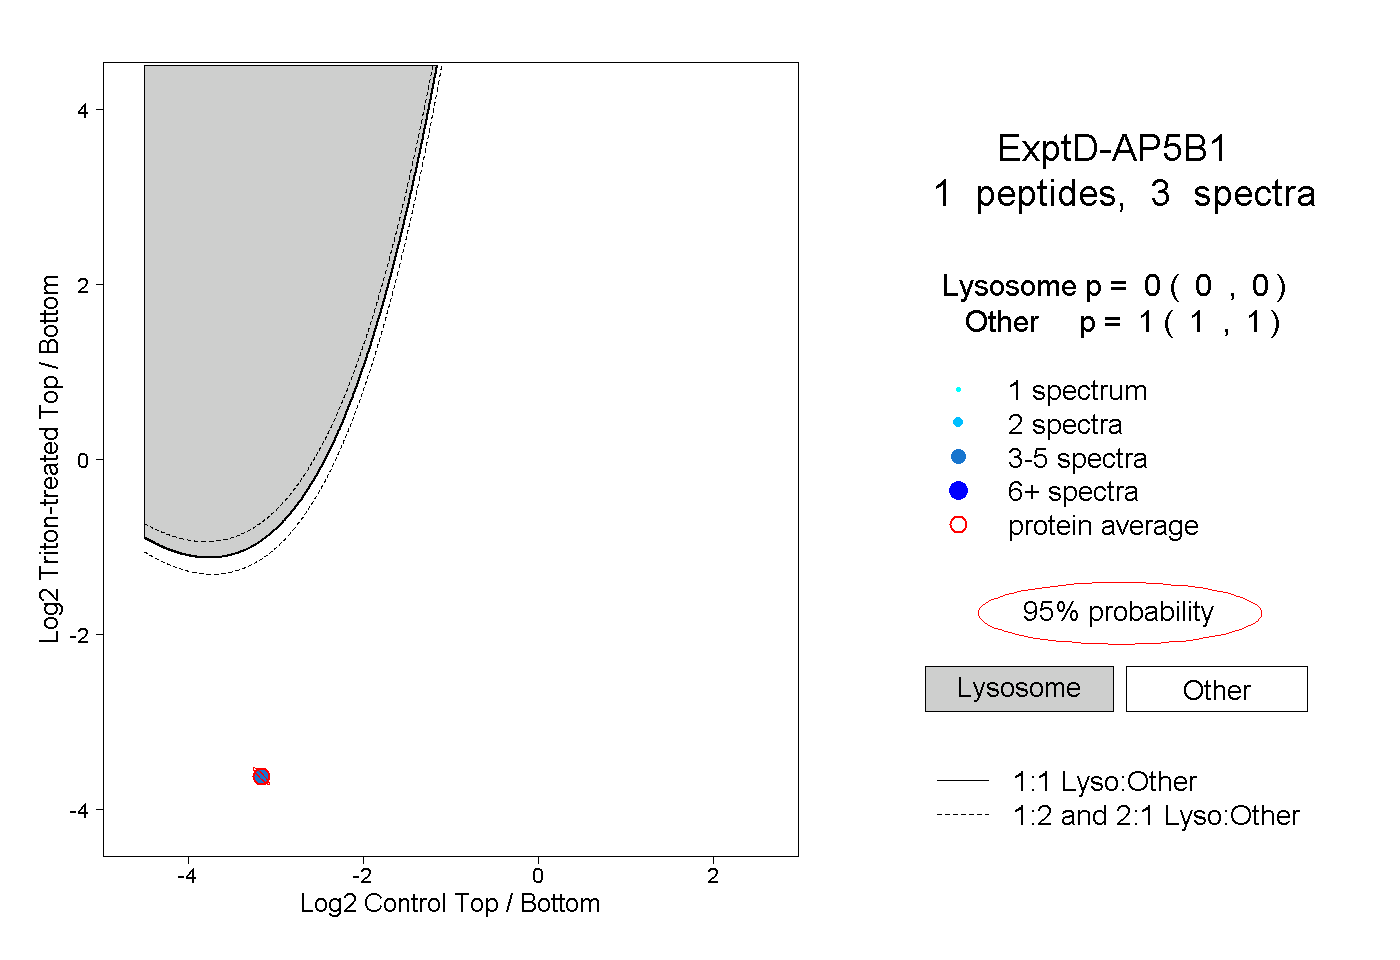
0.000 | 0.000
1.000 | 1.000