 6
6peptides
spectra
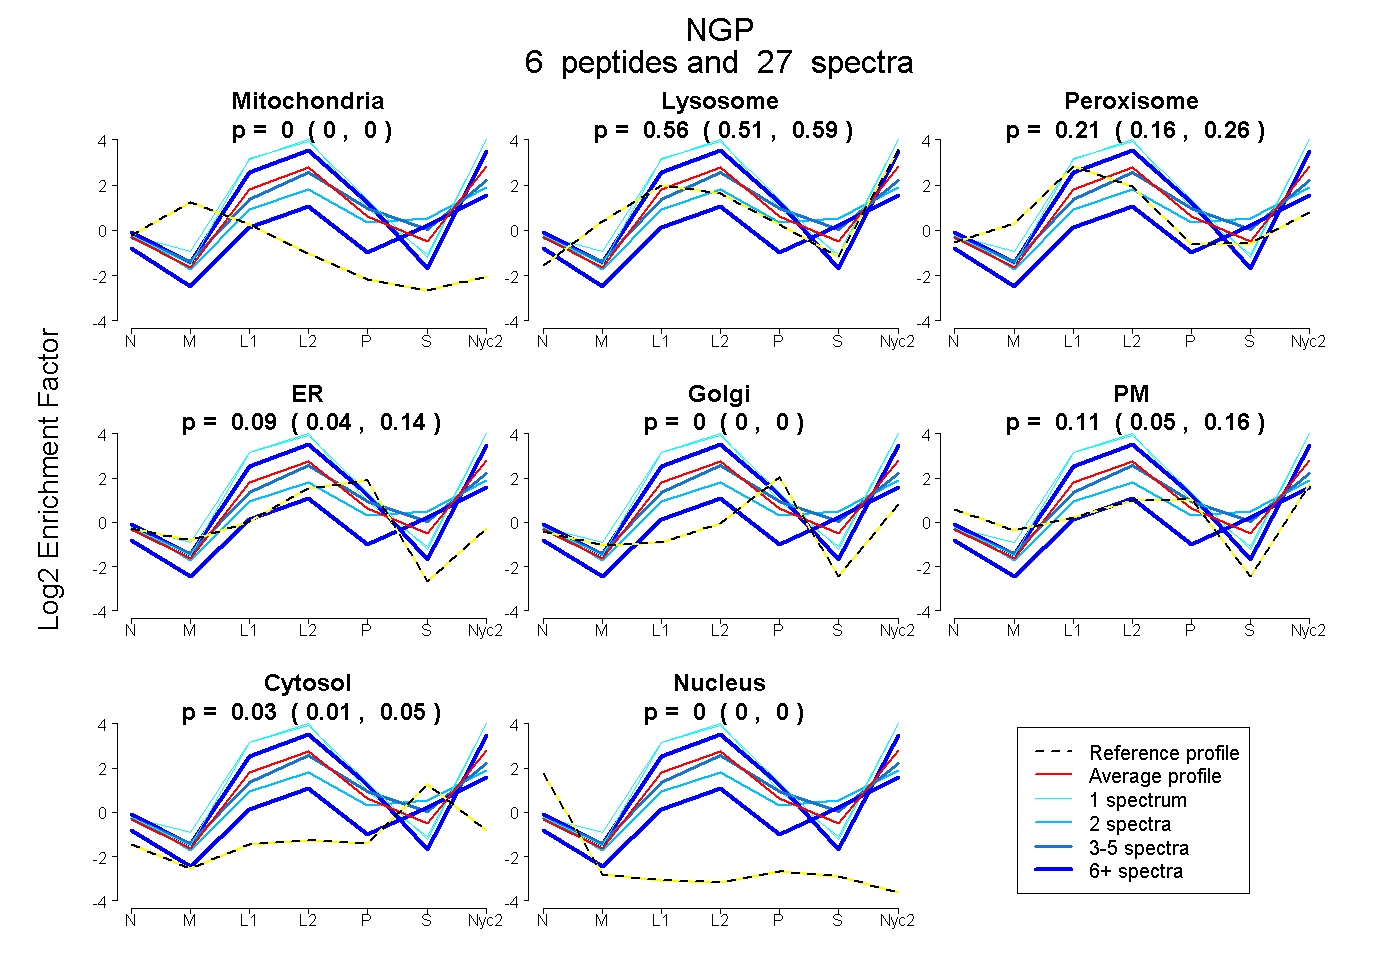
0.000 | 0.000
0.510 | 0.594
0.156 | 0.260
0.035 | 0.142
0.000 | 0.000
0.047 | 0.161
0.005 | 0.054
0.000 | 0.000
3peptides
spectra
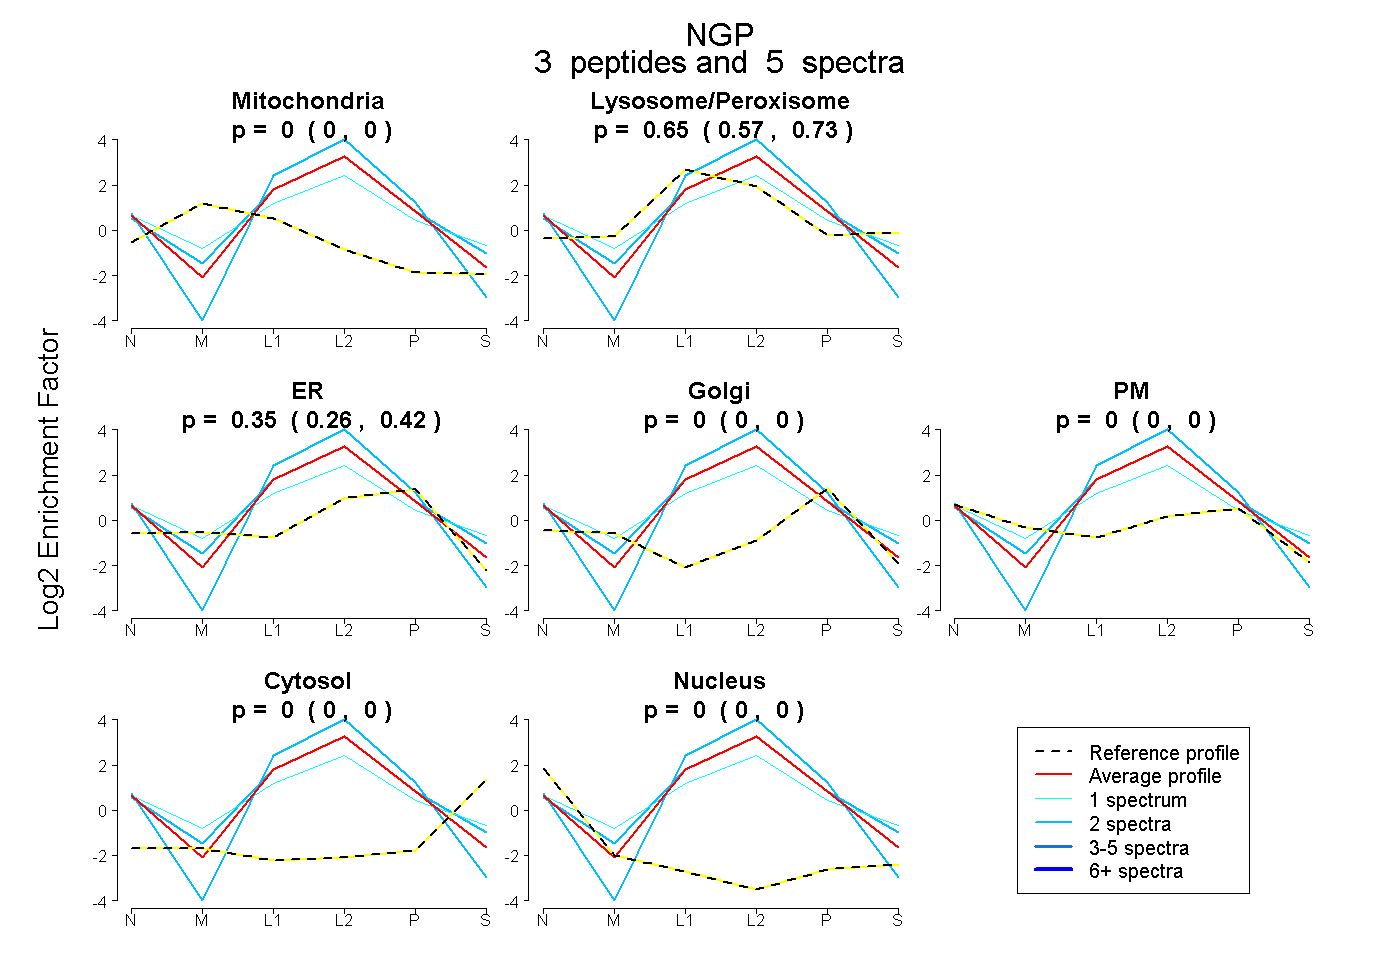
0.000 | 0.000
0.566 | 0.728
0.256 | 0.419
0.000 | 0.000
0.000 | 0.000
0.000 | 0.000
0.000 | 0.000
7peptides
spectra
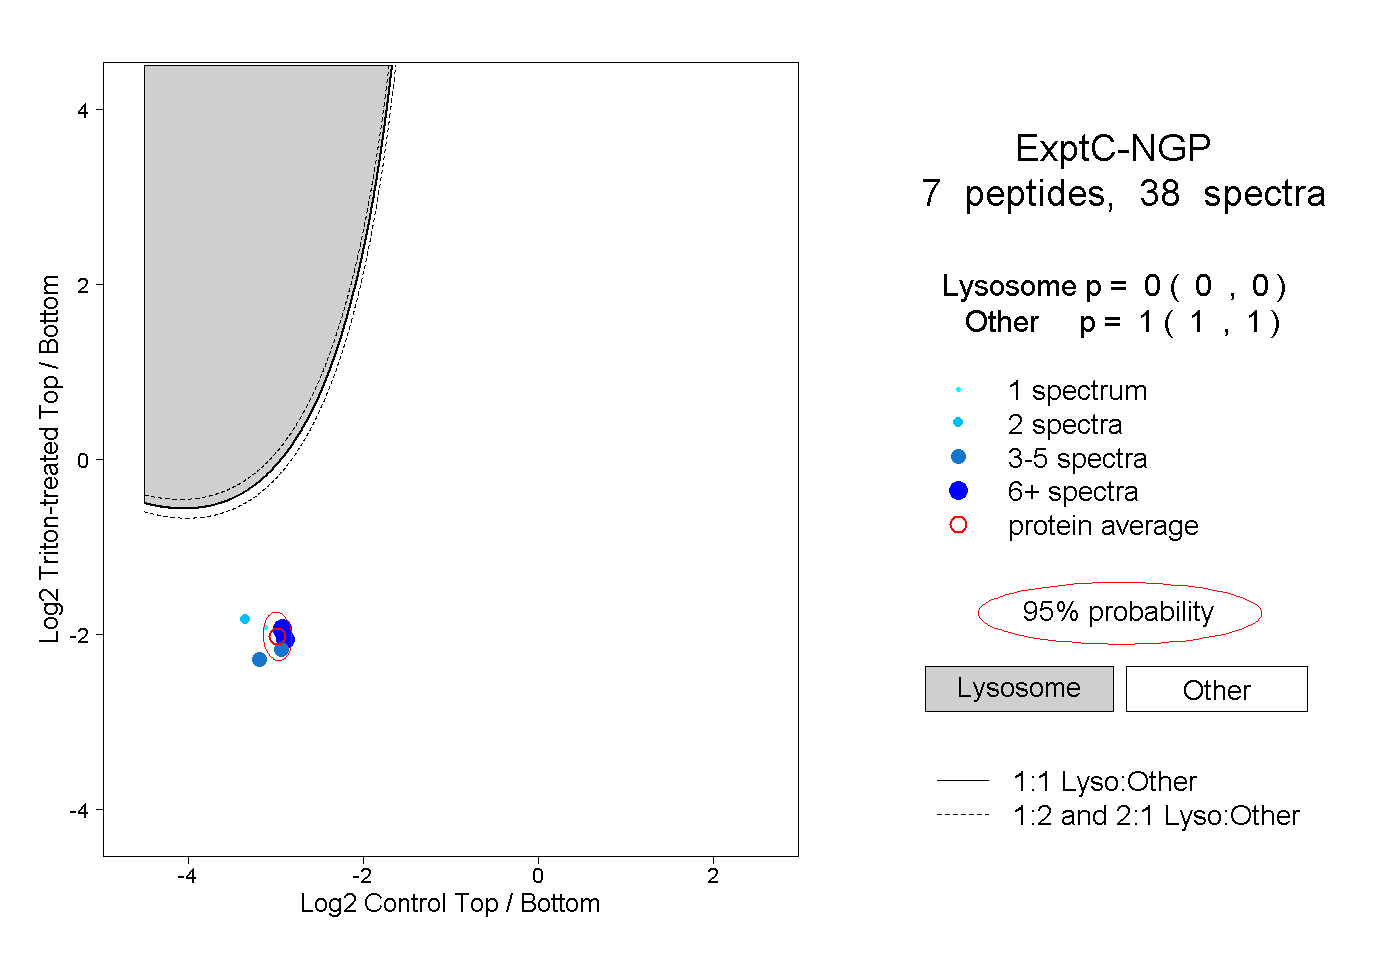
0.000 | 0.000
1.000 | 1.000
2peptides
spectra
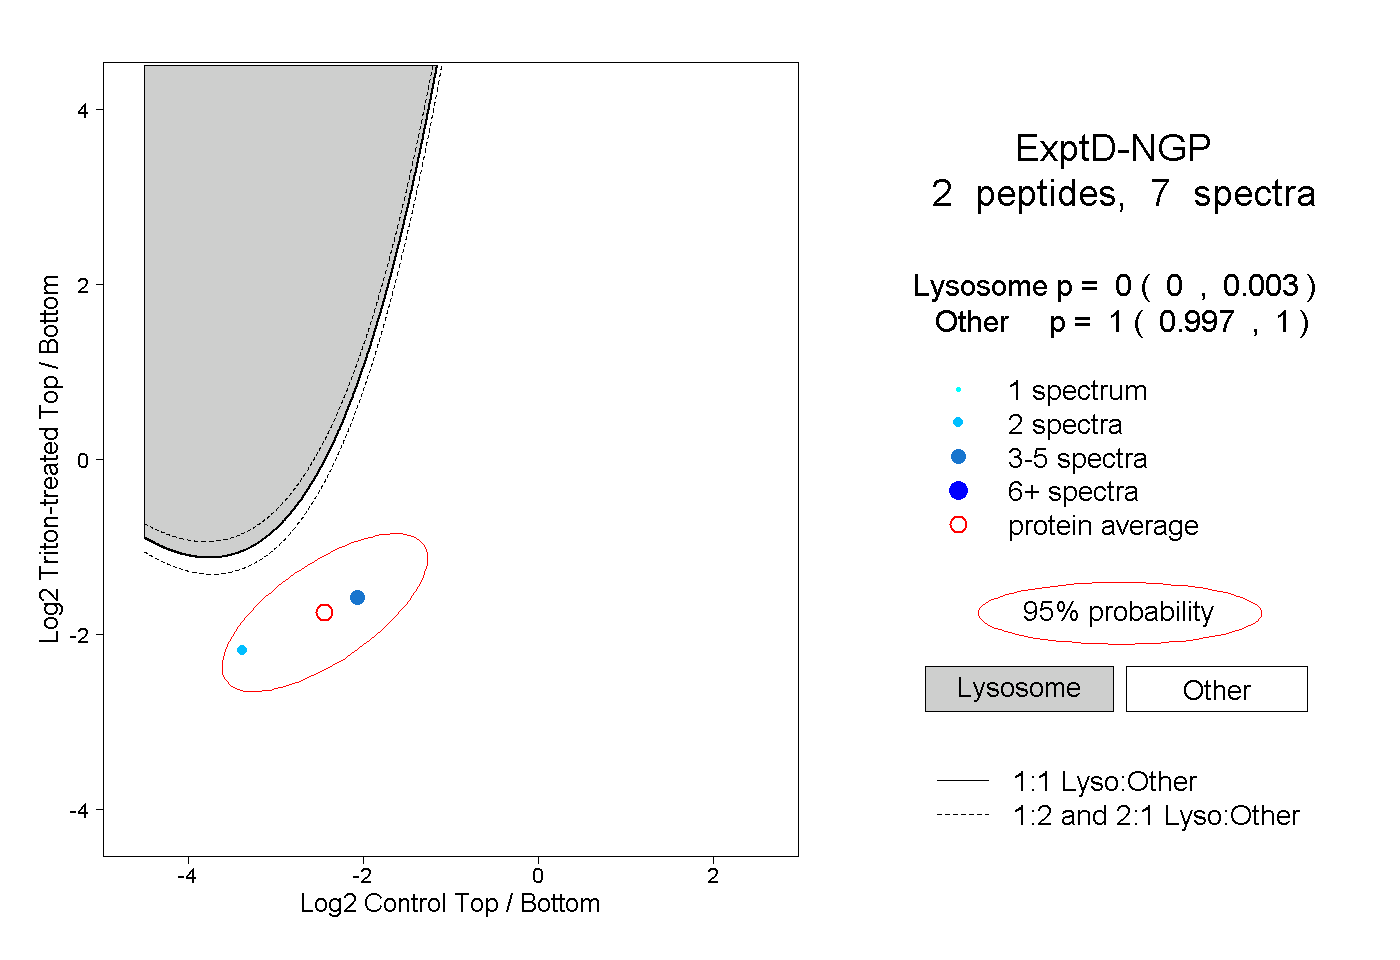
0.000 | 0.003
0.997 | 1.000