 6
6peptides
spectra
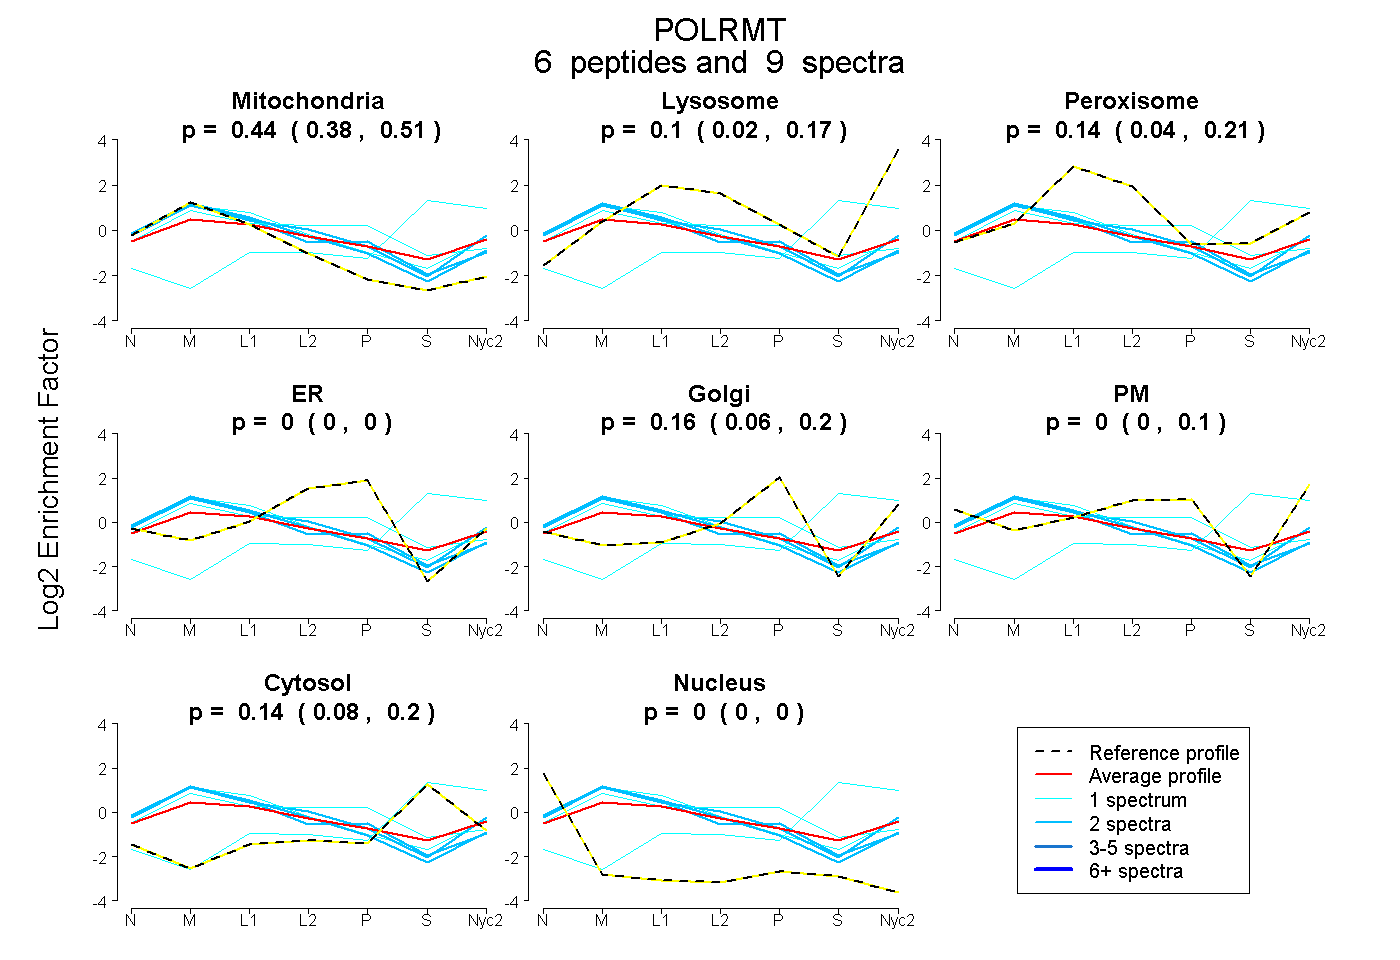
0.376 | 0.506
0.018 | 0.172
0.037 | 0.206
0.000 | 0.000
0.055 | 0.203
0.000 | 0.103
0.078 | 0.201
0.000 | 0.000
1peptide
spectrum
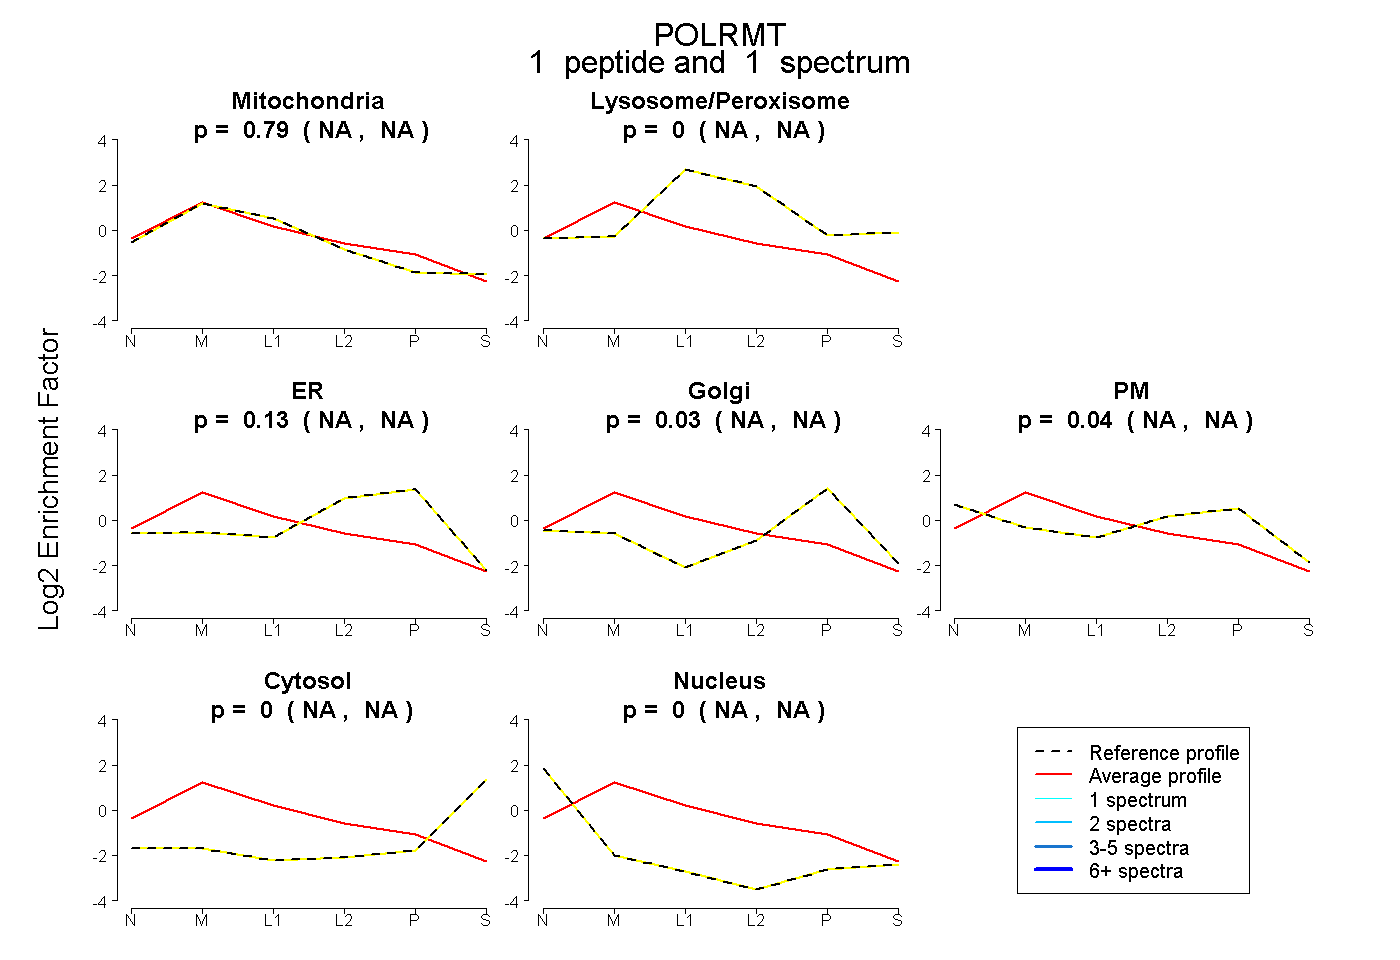
NA | NA
NA | NA
NA | NA
NA | NA
NA | NA
NA | NA
NA | NA
10peptides
spectra
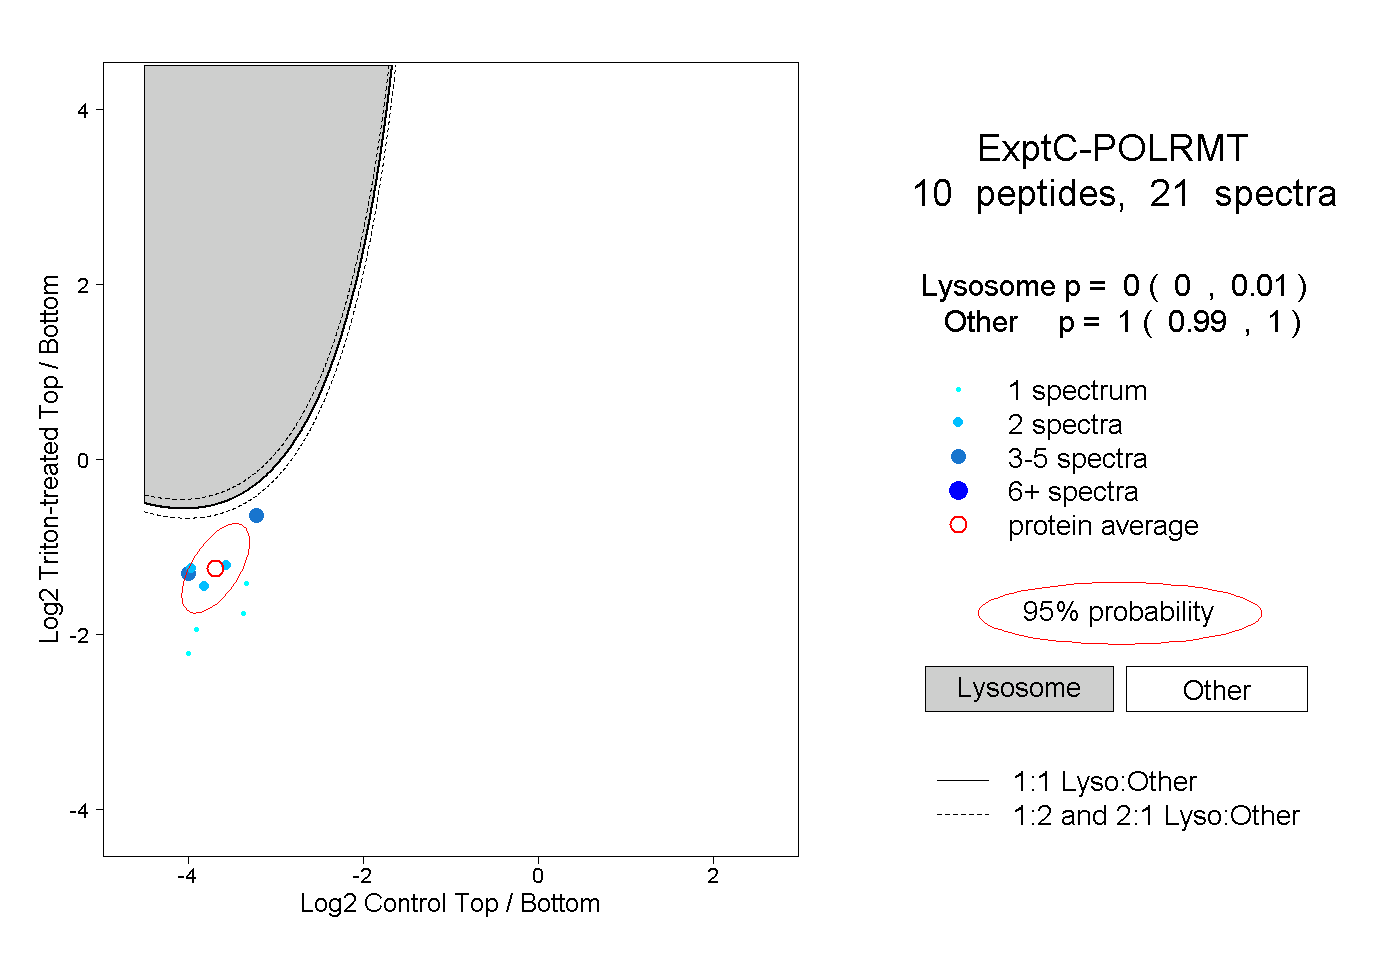
0.000 | 0.010
0.990 | 1.000
2peptides
spectra
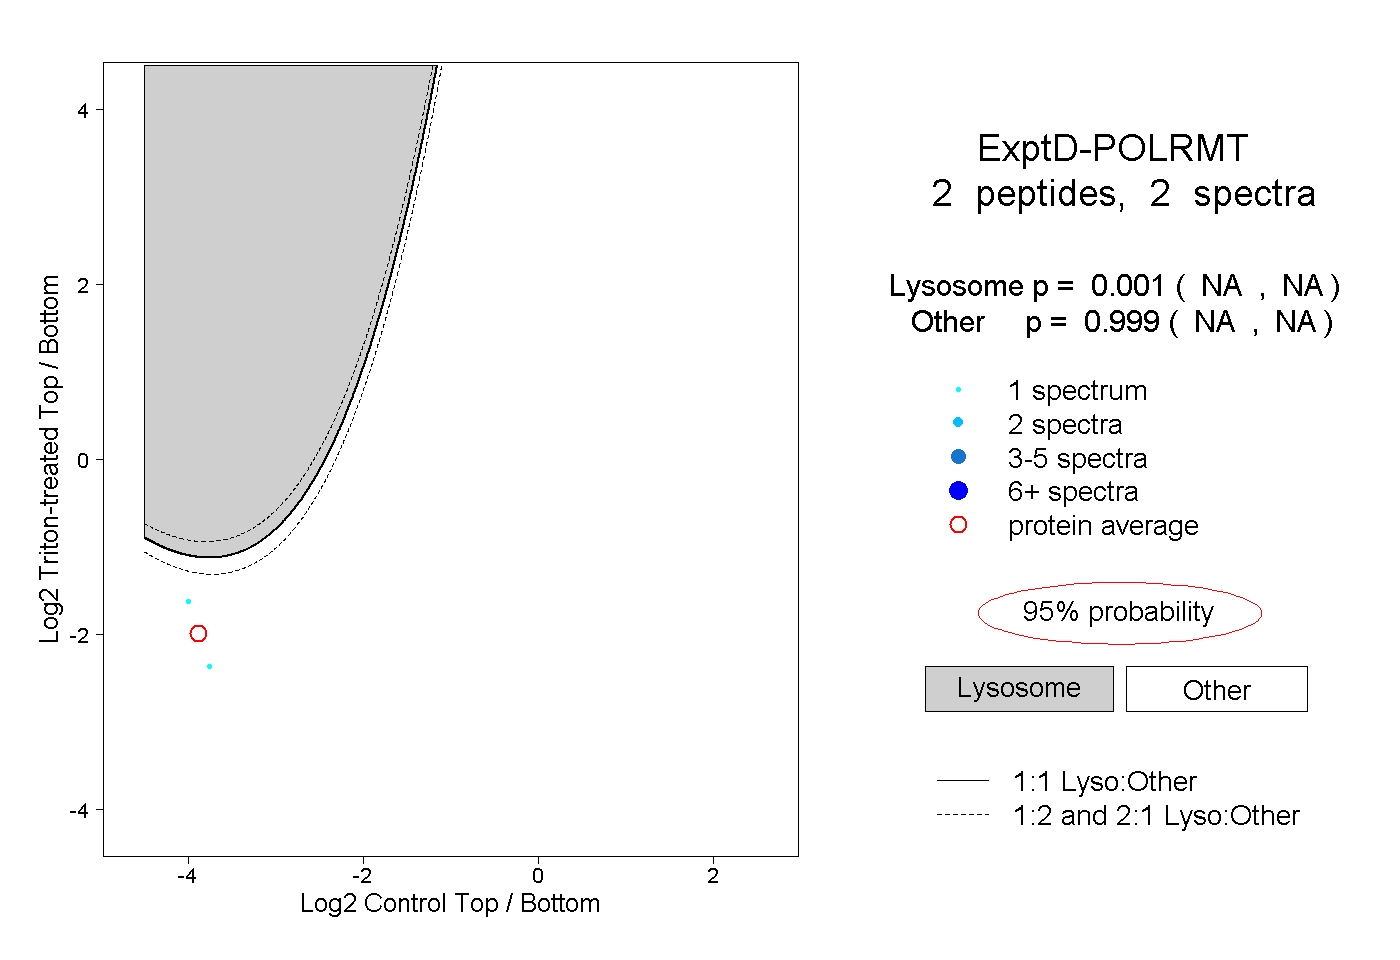
NA | NA
NA | NA