 6
6peptides
spectra
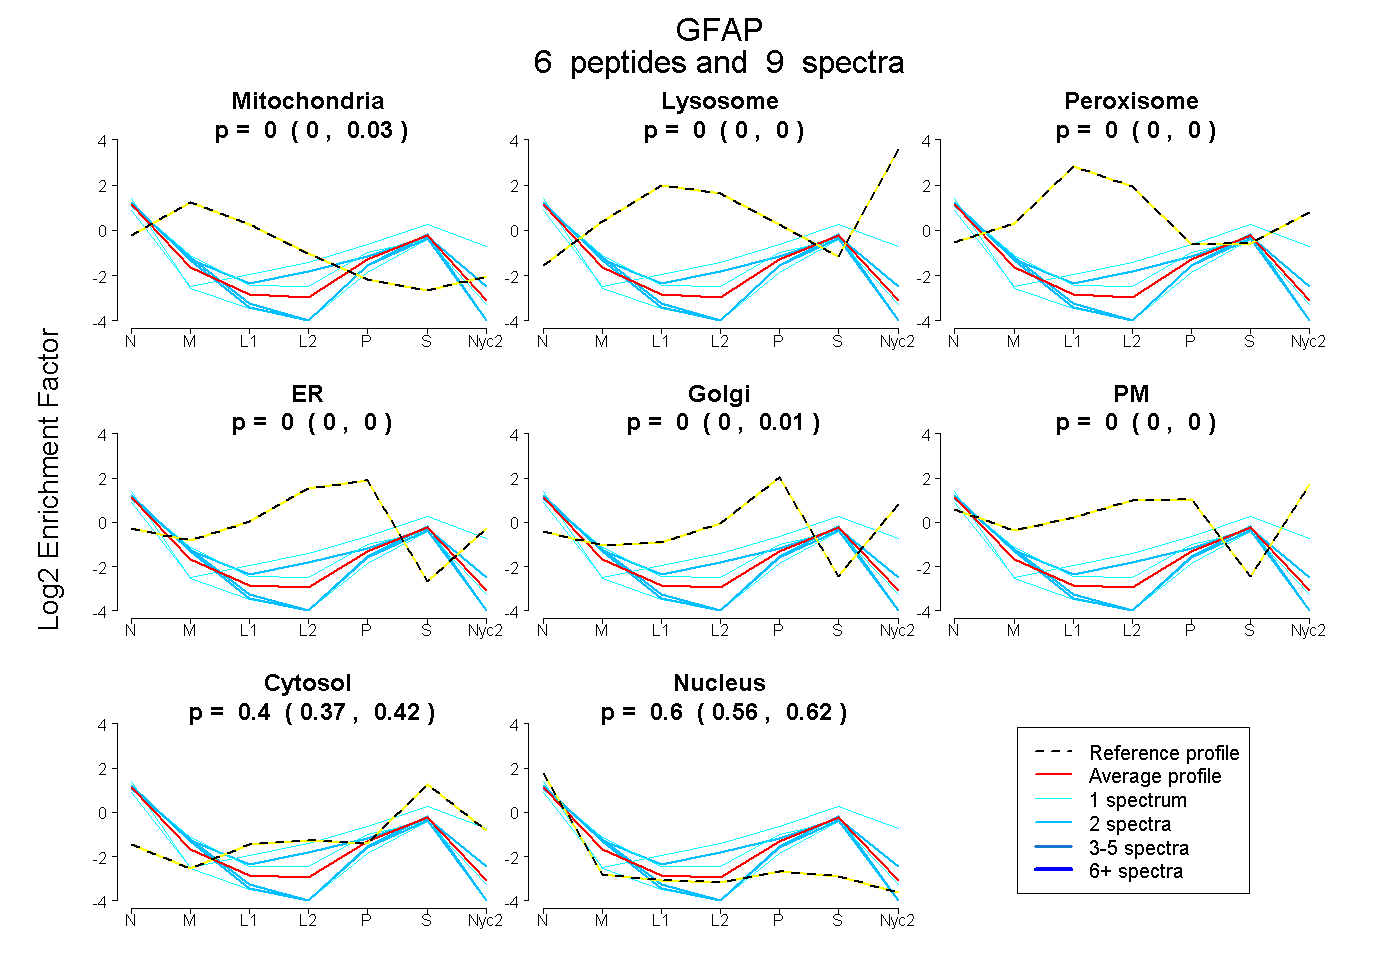
0.000 | 0.030
0.000 | 0.000
0.000 | 0.000
0.000 | 0.000
0.000 | 0.011
0.000 | 0.000
0.370 | 0.418
0.558 | 0.619
| Plot | Mito | Lyso | Perox | ER | Golgi | PM | Cytosol | Nucleus | |||||
| Expt A |
6 peptides |
9 spectra |
|
0.002 0.000 | 0.030 |
0.000 0.000 | 0.000 |
0.000 0.000 | 0.000 |
0.000 0.000 | 0.000 |
0.000 0.000 | 0.011 |
0.000 0.000 | 0.000 |
0.402 0.370 | 0.418 |
0.596 0.558 | 0.619 |
| 1 spectrum, HLGTIPR | 0.000 | 0.000 | 0.000 | 0.000 | 0.009 | 0.189 | 0.559 | 0.243 | ||
| 2 spectra, ESASYQEALAR | 0.093 | 0.000 | 0.000 | 0.058 | 0.000 | 0.024 | 0.392 | 0.433 | ||
| 2 spectra, LADVYQAELR | 0.000 | 0.000 | 0.000 | 0.000 | 0.000 | 0.000 | 0.251 | 0.749 | ||
| 1 spectrum, ITIPVQTFSNLQIR | 0.000 | 0.000 | 0.000 | 0.000 | 0.000 | 0.000 | 0.218 | 0.782 | ||
| 2 spectra, DNLTQDLGTLR | 0.000 | 0.000 | 0.000 | 0.000 | 0.000 | 0.000 | 0.286 | 0.714 | ||
| 1 spectrum, FADLTDVASR | 0.132 | 0.000 | 0.000 | 0.007 | 0.019 | 0.000 | 0.329 | 0.514 |
| Plot | Lyso | Other | |||||||||||
| Expt C |
1 peptide |
2 spectra |
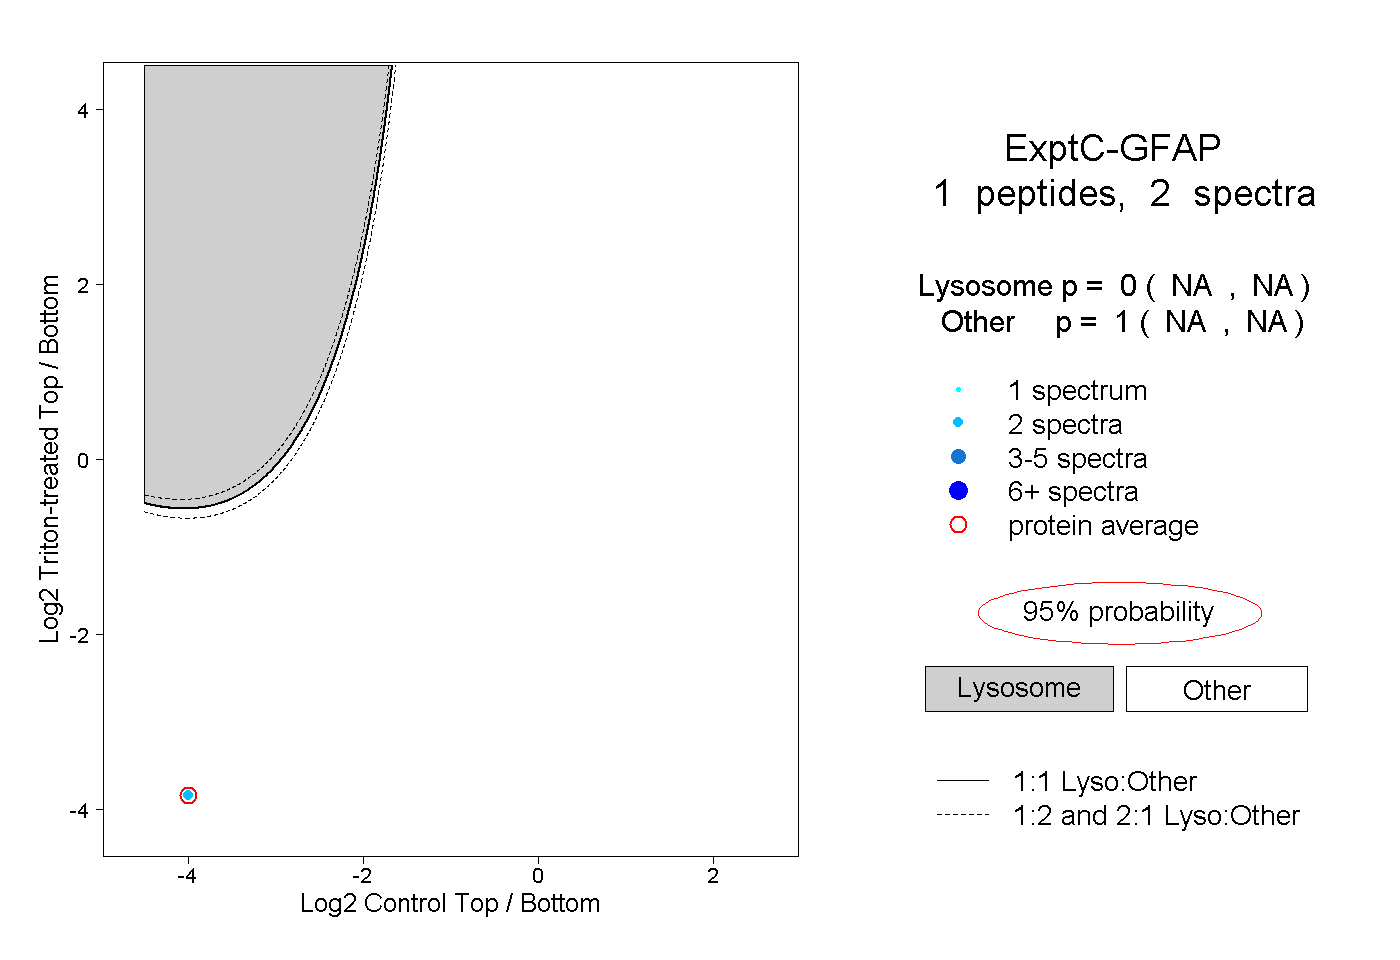 |
0.000 NA | NA |
1.000 NA | NA |
||||||||
| Plot | Lyso | Other | |||||||||||
| Expt D |
1 peptide |
1 spectrum |
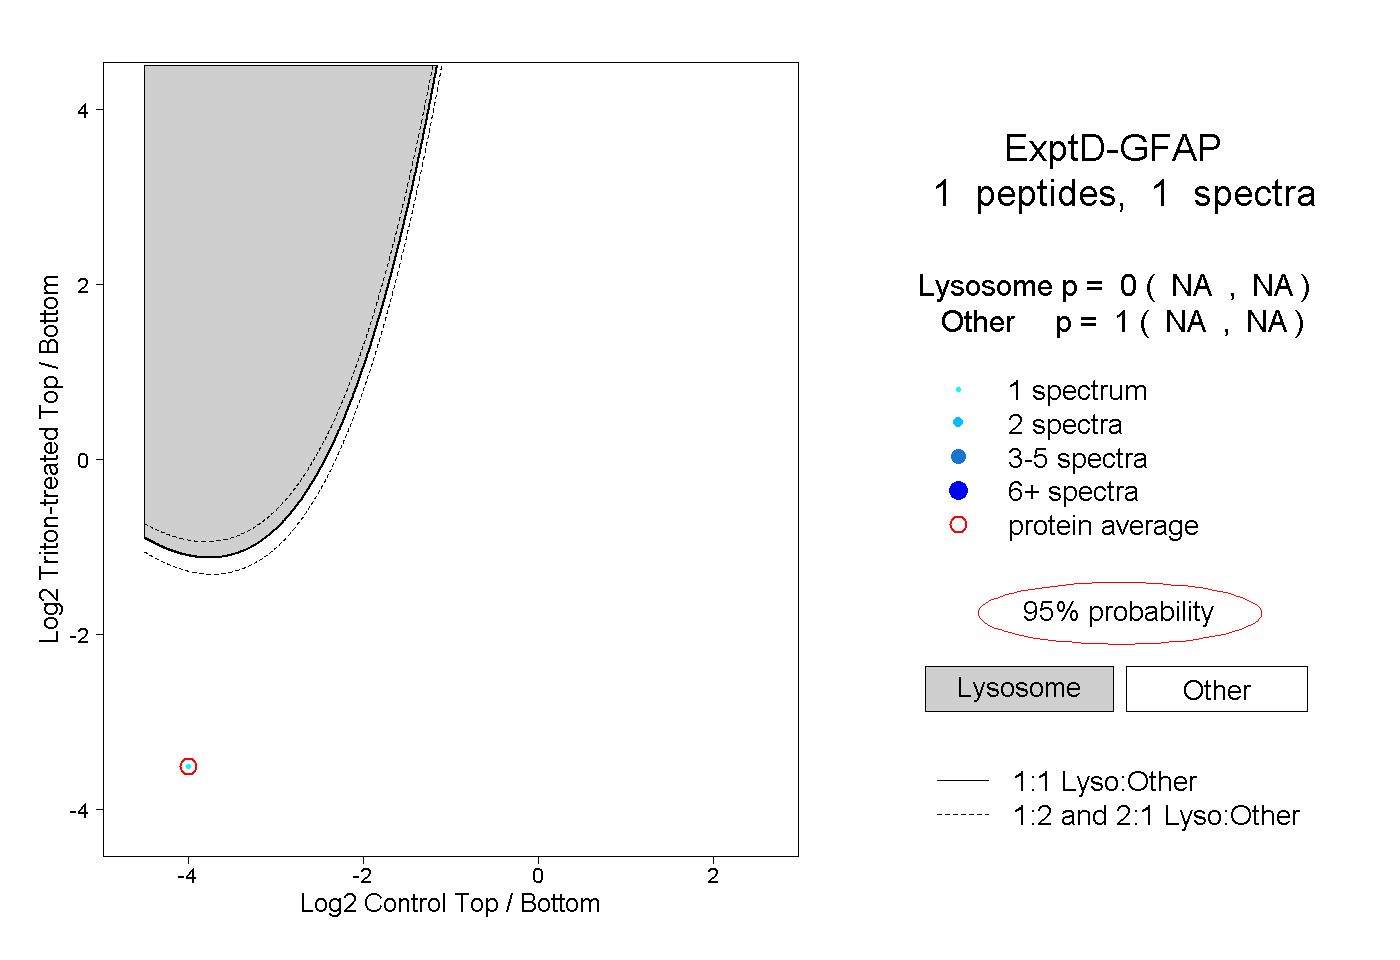 |
0.000 NA | NA |
1.000 NA | NA |