 8
8peptides
spectra
0.000 | 0.000
0.000 | 0.000
0.000 | 0.000
0.000 | 0.000
0.000 | 0.000
0.000 | 0.000
0.690 | 0.717
0.281 | 0.307
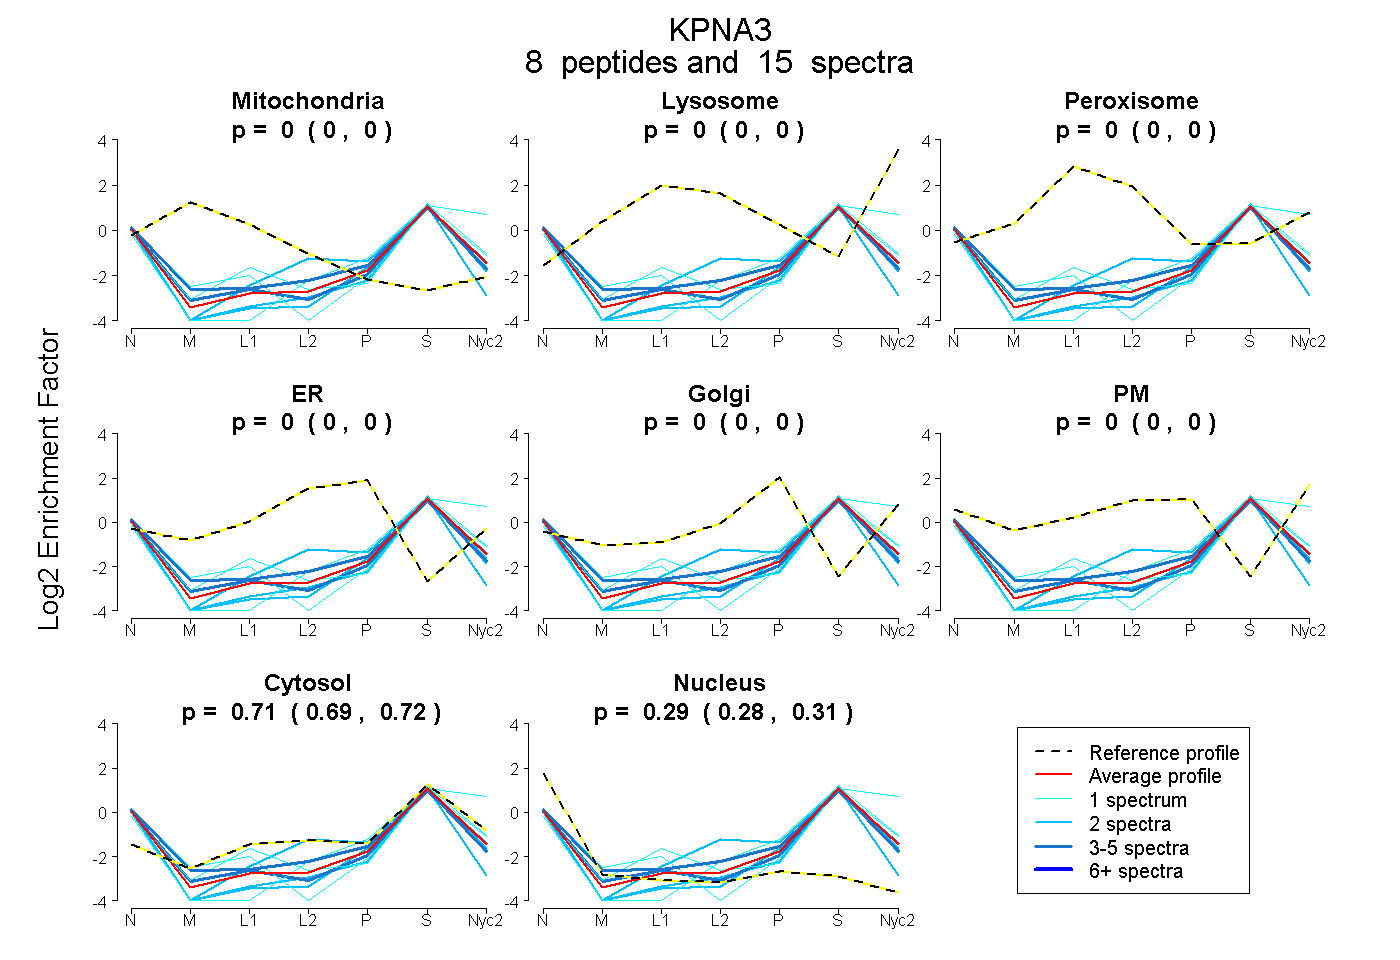
| Plot | Mito | Lyso | Perox | ER | Golgi | PM | Cytosol | Nucleus | |||||
| Expt A |
8 peptides |
15 spectra |
|
0.000 0.000 | 0.000 |
0.000 0.000 | 0.000 |
0.000 0.000 | 0.000 |
0.000 0.000 | 0.000 |
0.000 0.000 | 0.000 |
0.000 0.000 | 0.000 |
0.705 0.690 | 0.717 |
0.295 0.281 | 0.307 |
| 2 spectra, AENPGLENHR | 0.000 | 0.000 | 0.000 | 0.000 | 0.000 | 0.000 | 0.780 | 0.220 | ||
| 3 spectra, EAAWAISNLTISGR | 0.000 | 0.000 | 0.000 | 0.000 | 0.000 | 0.000 | 0.667 | 0.333 | ||
| 1 spectrum, NPPIDDLIK | 0.000 | 0.000 | 0.000 | 0.000 | 0.000 | 0.000 | 0.743 | 0.257 | ||
| 2 spectra, DEHLLK | 0.000 | 0.000 | 0.000 | 0.000 | 0.000 | 0.000 | 0.642 | 0.358 | ||
| 2 spectra, DSQVVQVVLDGLK | 0.000 | 0.000 | 0.000 | 0.000 | 0.000 | 0.000 | 0.554 | 0.446 | ||
| 1 spectrum, SGILPILVK | 0.000 | 0.000 | 0.000 | 0.000 | 0.000 | 0.000 | 0.679 | 0.321 | ||
| 3 spectra, VQTAALR | 0.000 | 0.000 | 0.000 | 0.000 | 0.000 | 0.000 | 0.729 | 0.271 | ||
| 1 spectrum, IEVLQQHENEDIYK | 0.000 | 0.023 | 0.000 | 0.000 | 0.000 | 0.000 | 0.855 | 0.121 |
| Plot | Mito | Lyso or Perox | ER | Golgi | PM | Cytosol | Nucleus | ||||||
| Expt B |
1 peptide |
1 spectrum |
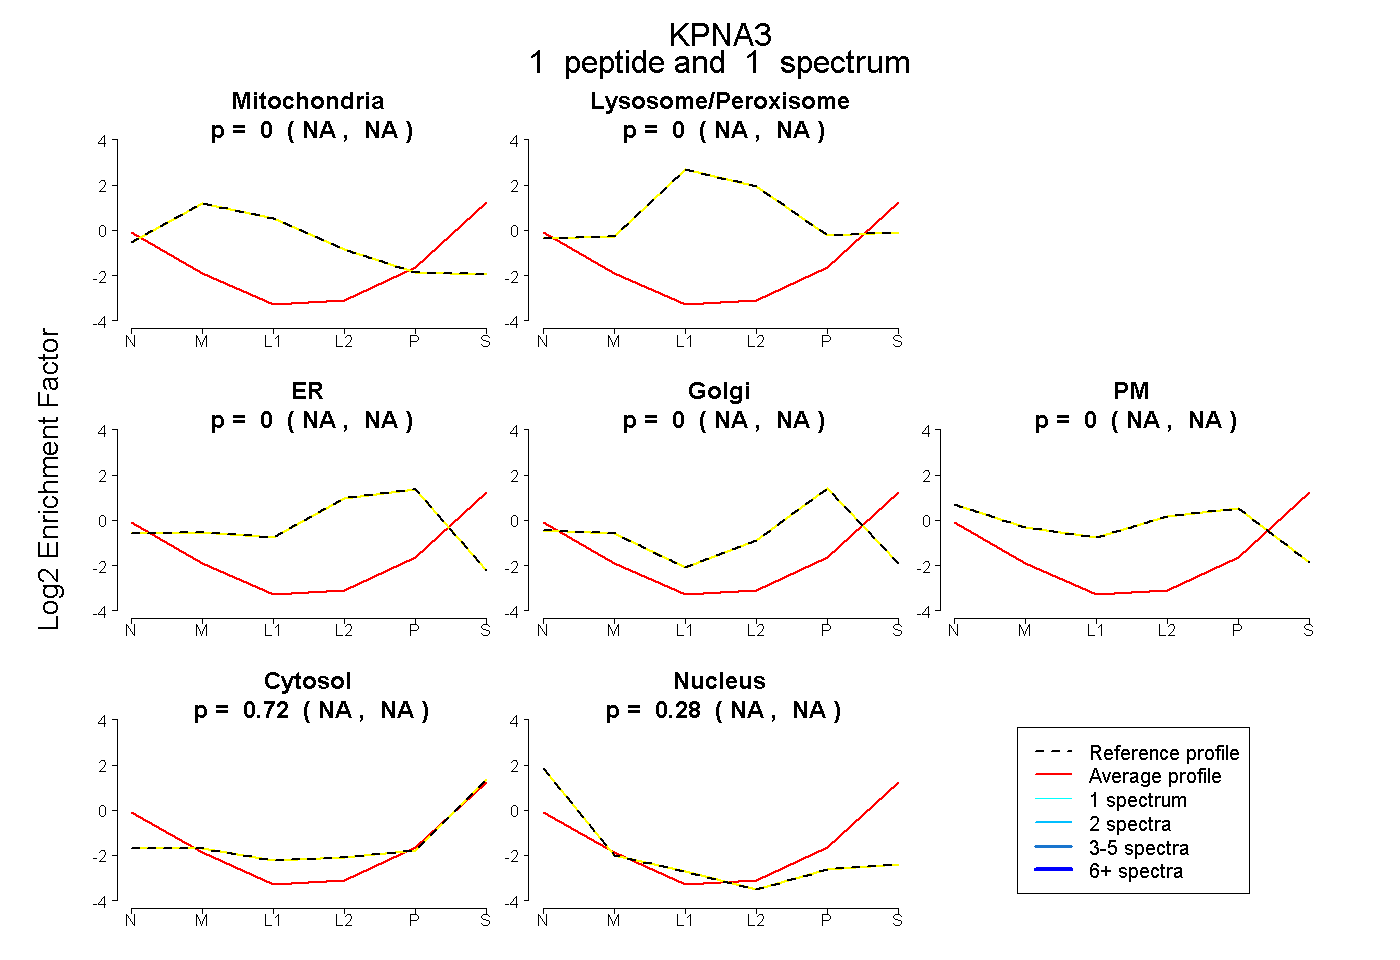 |
0.000 NA | NA |
0.000 NA | NA |
0.000 NA | NA |
0.000 NA | NA |
0.000 NA | NA |
0.723 NA | NA |
0.277 NA | NA |
|||
| Plot | Lyso | Other | |||||||||||
| Expt C |
1 peptide |
2 spectra |
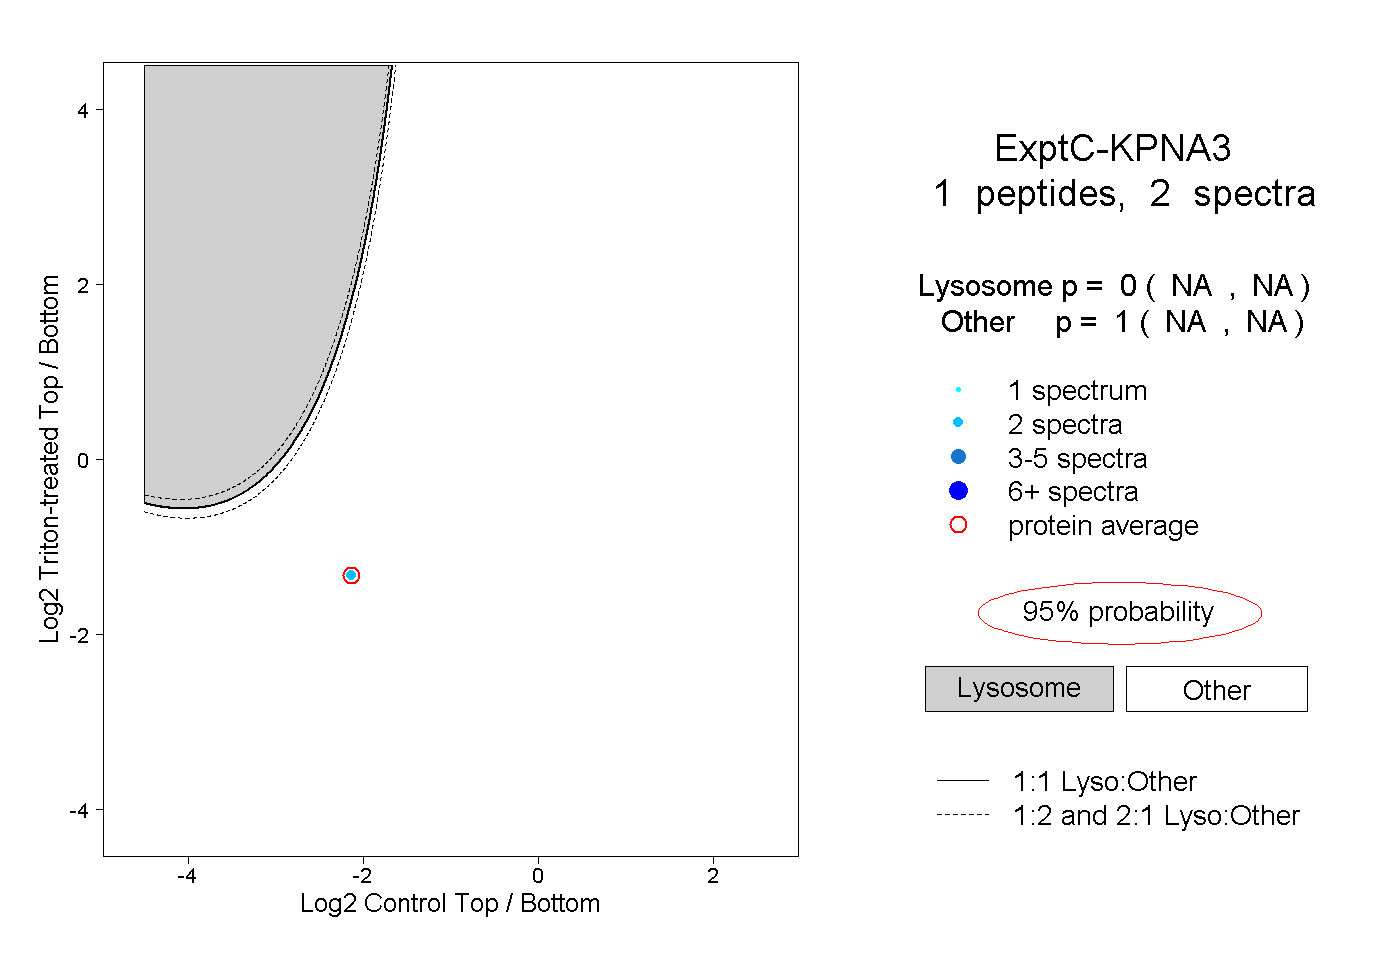 |
0.000 NA | NA |
1.000 NA | NA |
||||||||
| Plot | Lyso | Other | |||||||||||
| Expt D |
1 peptide |
1 spectrum |
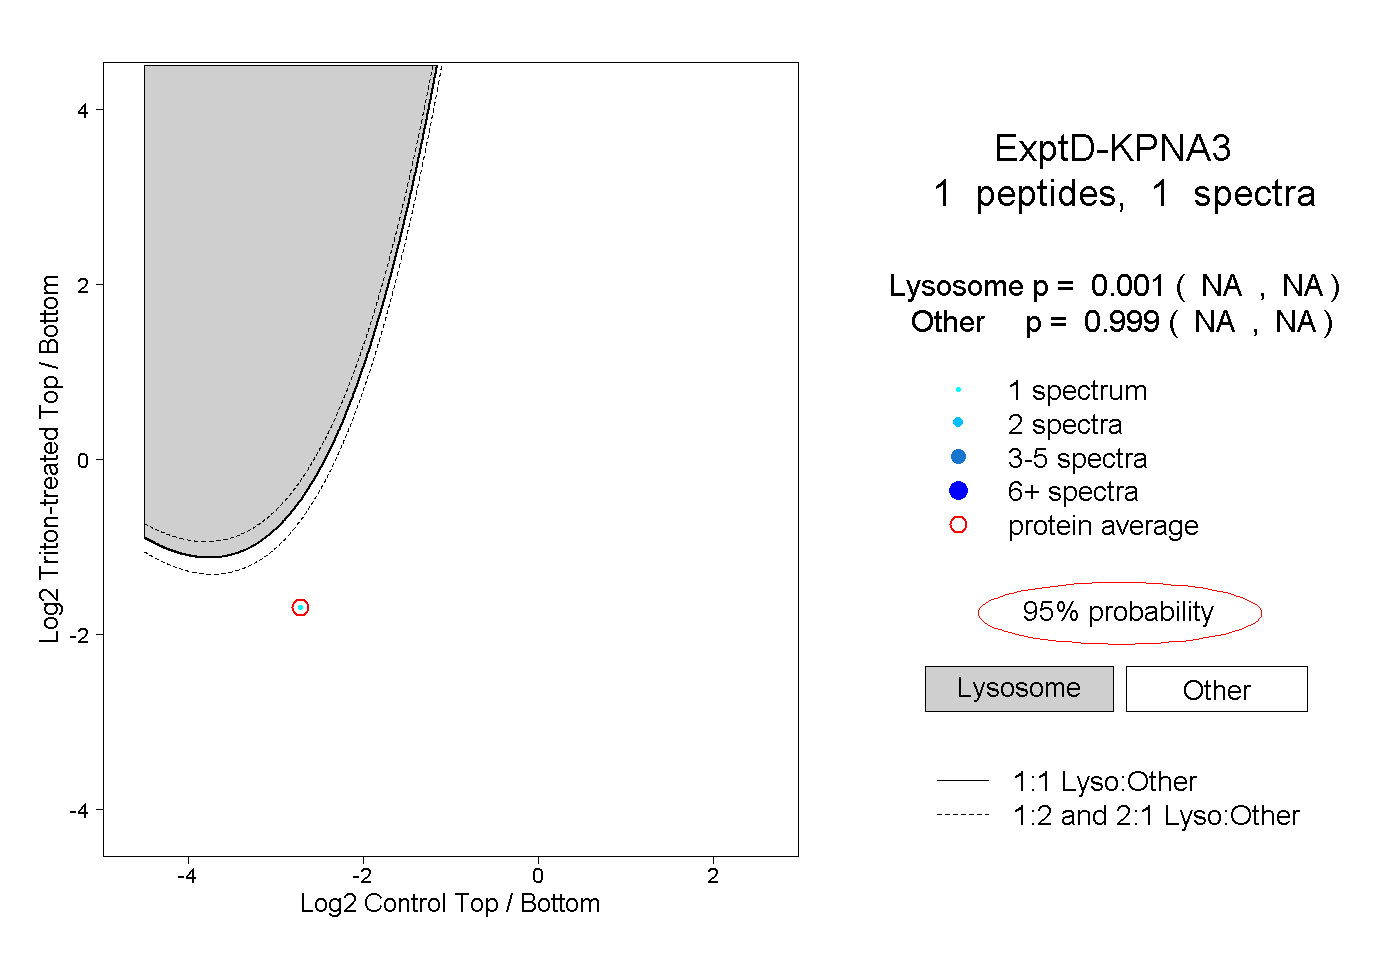 |
0.001 NA | NA |
0.999 NA | NA |