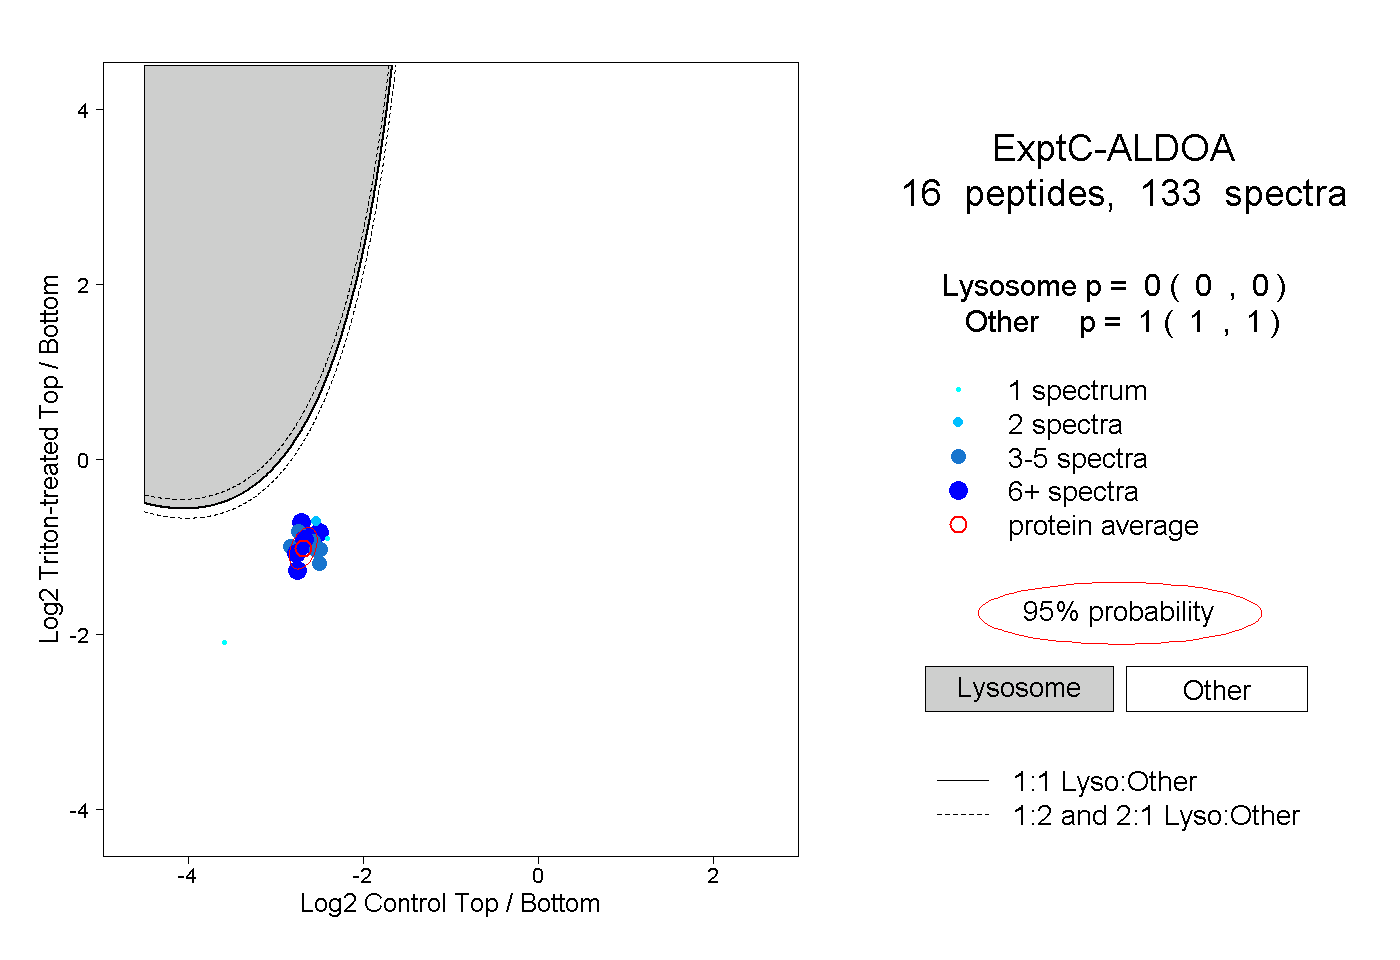
16
16peptides
spectra
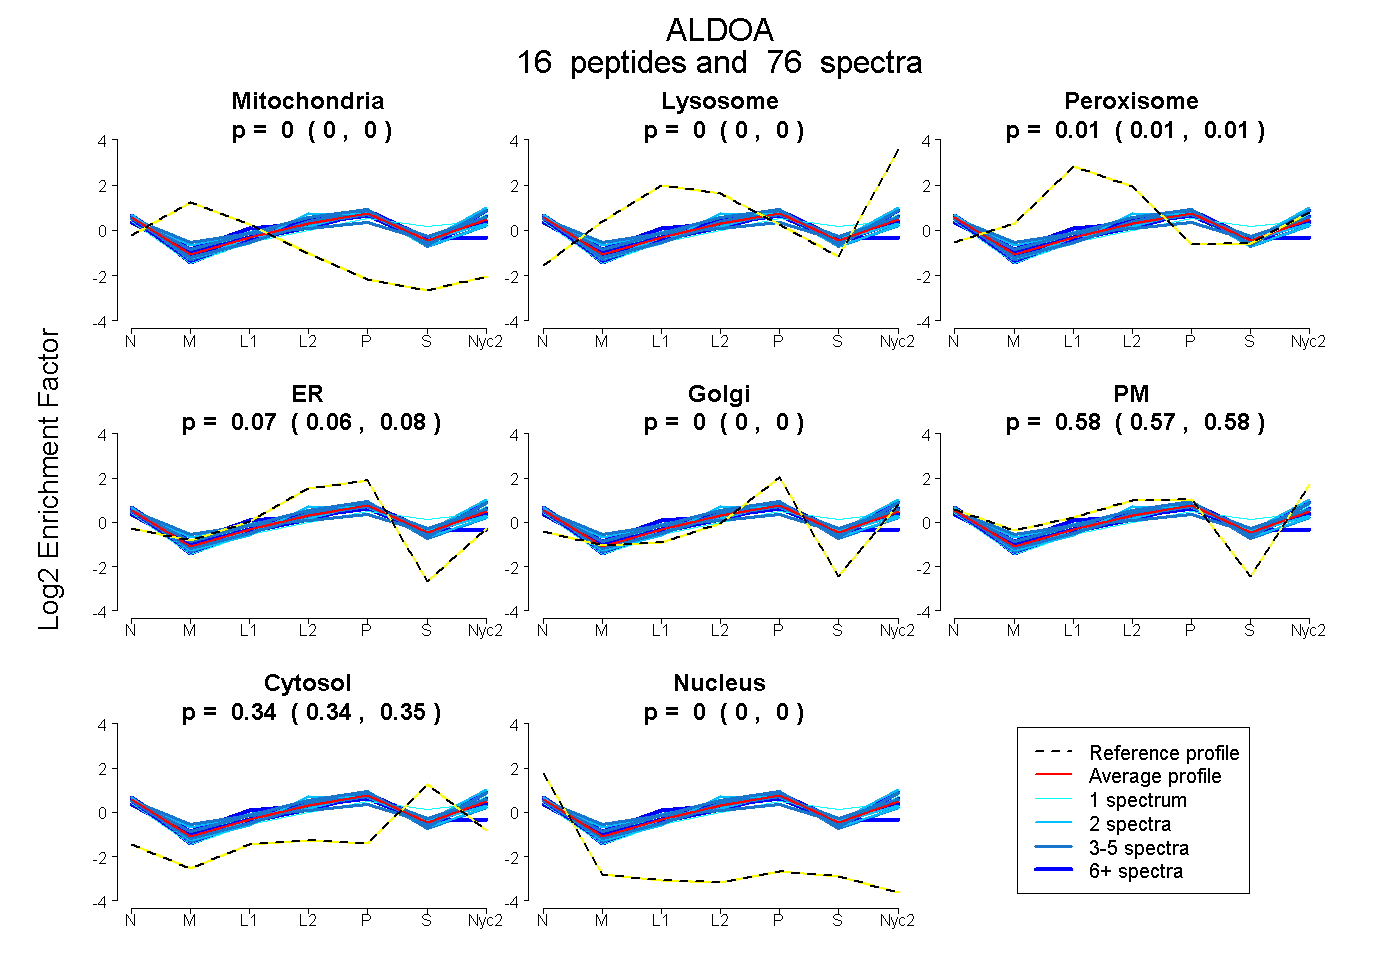
0.000 | 0.000
0.000 | 0.000
0.007 | 0.013
0.064 | 0.075
0.000 | 0.000
0.568 | 0.581
0.343 | 0.346
0.000 | 0.000
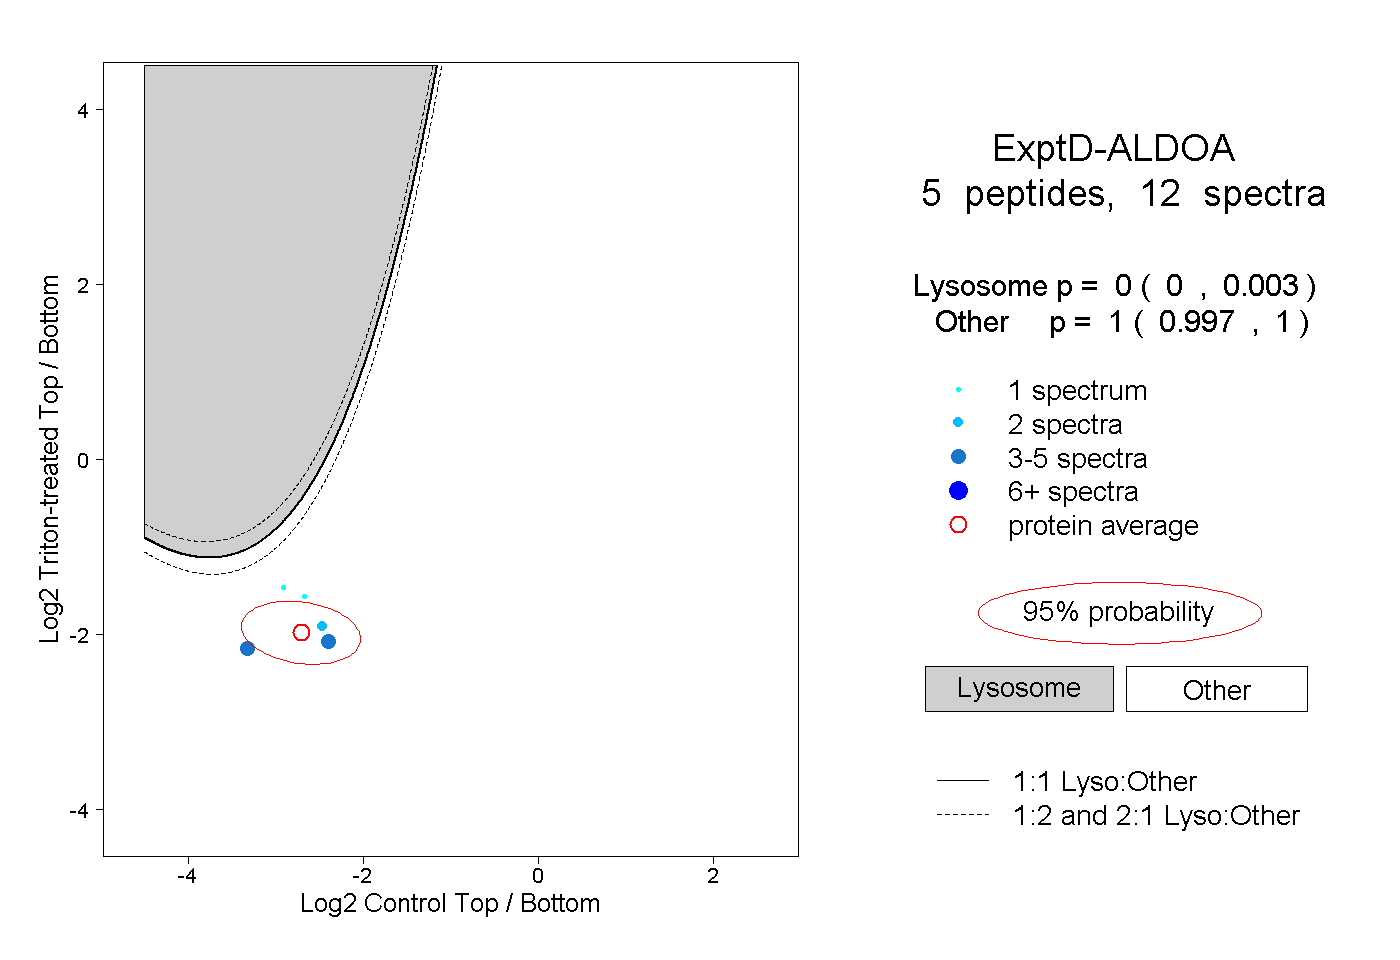
6peptides
spectra
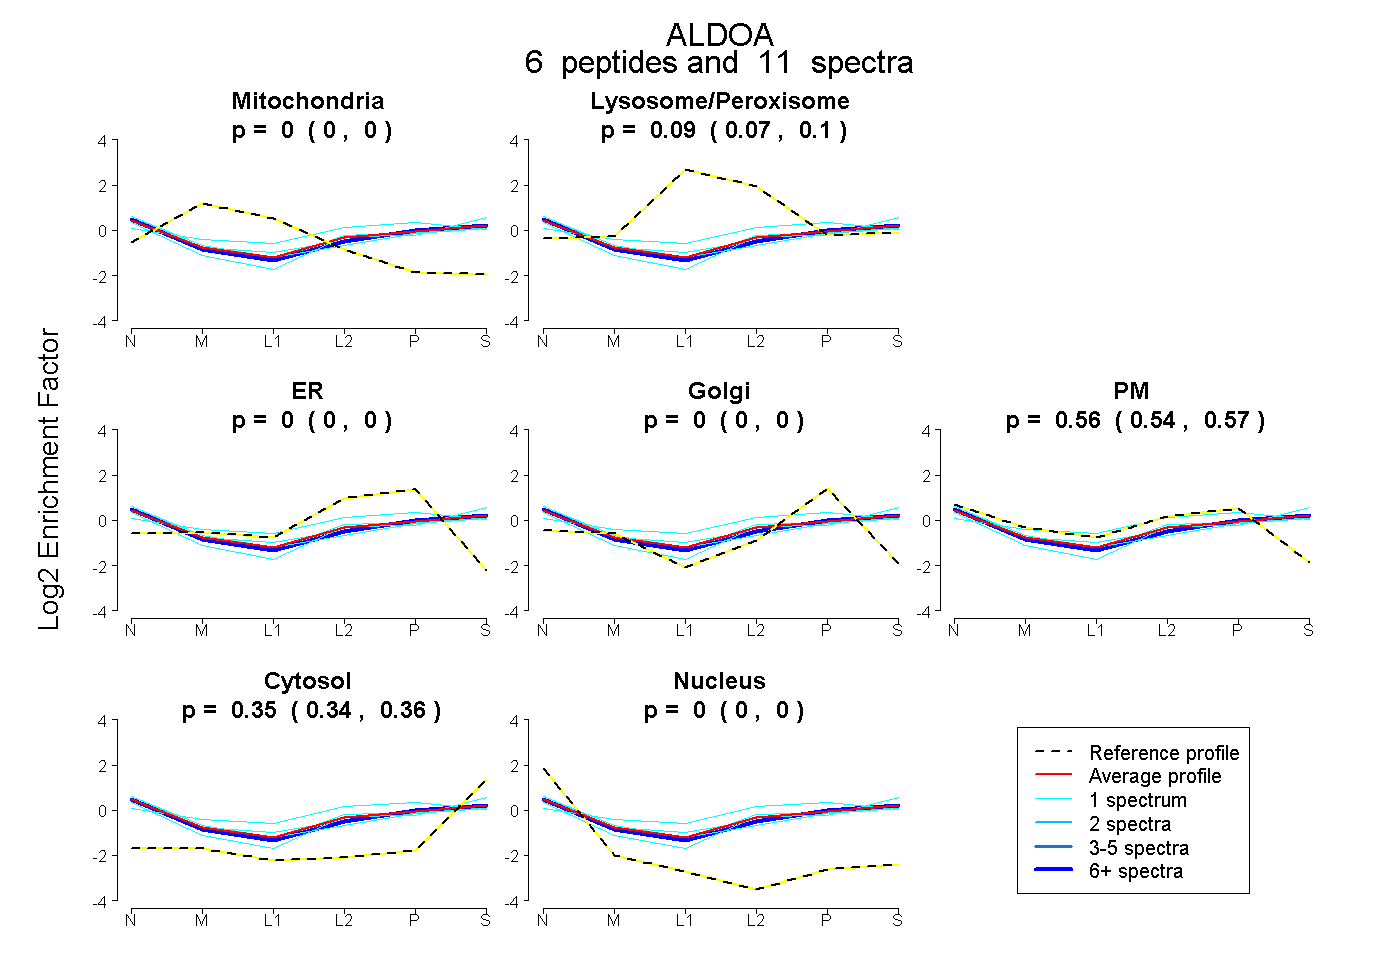
0.000 | 0.000
0.070 | 0.103
0.000 | 0.000
0.000 | 0.000
0.540 | 0.571
0.345 | 0.364
0.000 | 0.000