 16
16peptides
spectra
0.000 | 0.000
0.000 | 0.000
0.007 | 0.013
0.064 | 0.075
0.000 | 0.000
0.568 | 0.581
0.343 | 0.346
0.000 | 0.000
| Plot | Mito | Lyso | Perox | ER | Golgi | PM | Cytosol | Nucleus | |||||
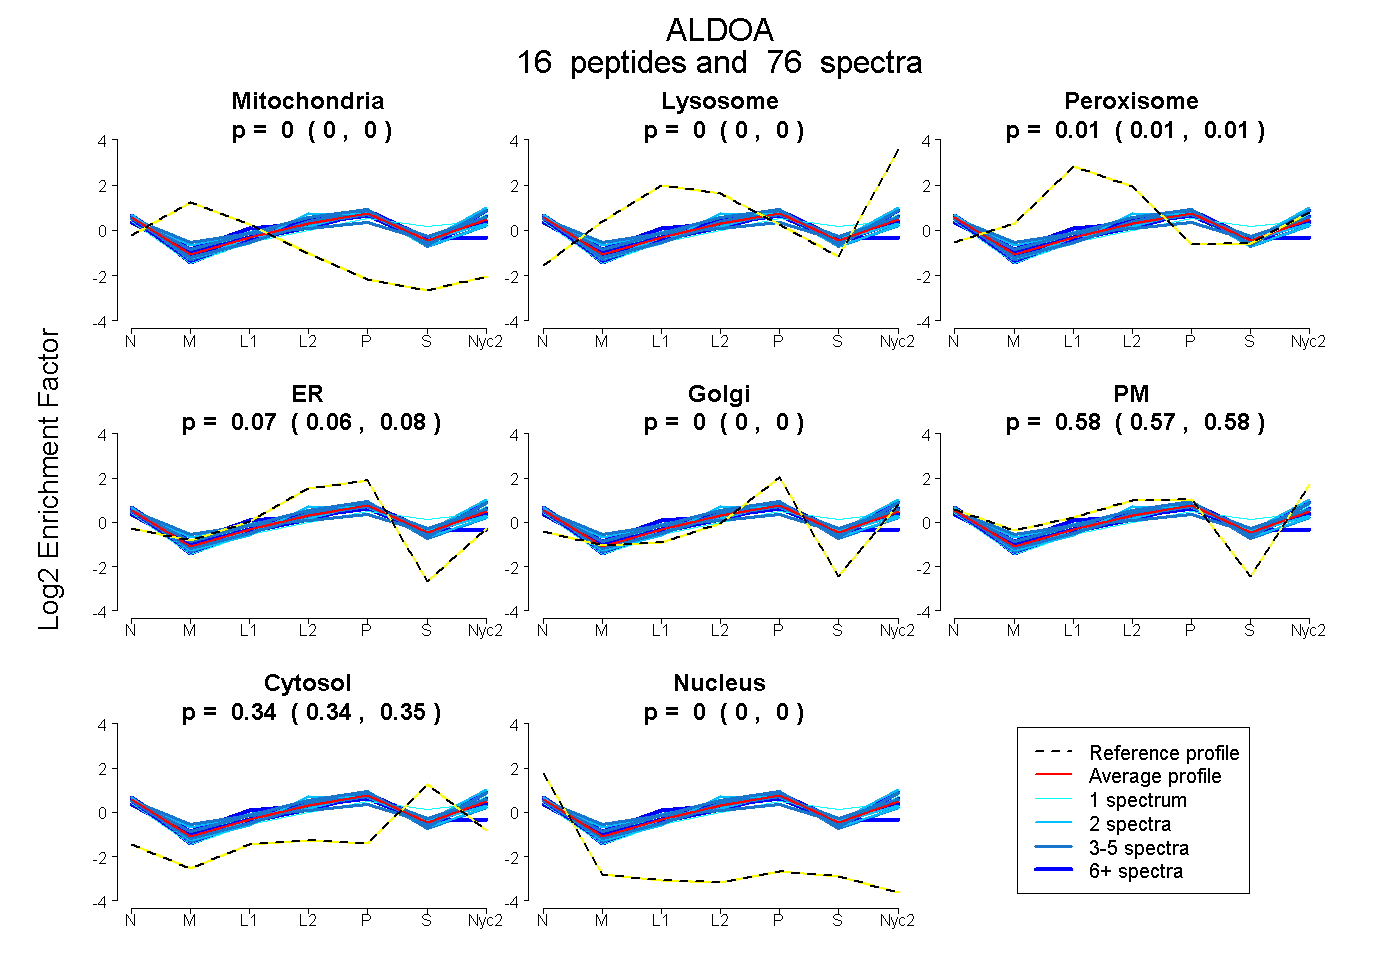
| Expt A |
16 peptides |
76 spectra |
|
0.000 0.000 | 0.000 |
0.000 0.000 | 0.000 |
0.010 0.007 | 0.013 |
0.070 0.064 | 0.075 |
0.000 0.000 | 0.000 |
0.575 0.568 | 0.581 |
0.345 0.343 | 0.346 |
0.000 0.000 | 0.000 |
| 3 spectra, IVAPGK | 0.000 | 0.000 | 0.000 | 0.000 | 0.015 | 0.658 | 0.326 | 0.000 | ||
| 4 spectra, IGEHTPSSLAIMENANVLAR | 0.004 | 0.000 | 0.105 | 0.000 | 0.000 | 0.555 | 0.322 | 0.014 | ||
| 1 spectrum, GGVVGIK | 0.000 | 0.000 | 0.000 | 0.000 | 0.000 | 0.525 | 0.475 | 0.000 | ||
| 8 spectra, FSNEEIAMATVTALR | 0.000 | 0.000 | 0.000 | 0.000 | 0.000 | 0.690 | 0.310 | 0.000 | ||
| 2 spectra, GILAADESTGSIAK | 0.000 | 0.000 | 0.000 | 0.118 | 0.000 | 0.517 | 0.363 | 0.002 | ||
| 4 spectra, QLLLTADDR | 0.000 | 0.000 | 0.000 | 0.023 | 0.000 | 0.596 | 0.381 | 0.000 | ||
| 8 spectra, DGADFAK | 0.000 | 0.000 | 0.119 | 0.060 | 0.000 | 0.507 | 0.306 | 0.008 | ||
| 8 spectra, CQYVTEK | 0.000 | 0.000 | 0.038 | 0.327 | 0.000 | 0.247 | 0.372 | 0.016 | ||
| 9 spectra, AAQEEYIK | 0.000 | 0.000 | 0.000 | 0.033 | 0.014 | 0.594 | 0.359 | 0.000 | ||
| 1 spectrum, AWGGK | 0.000 | 0.000 | 0.022 | 0.005 | 0.000 | 0.657 | 0.316 | 0.000 | ||
| 4 spectra, PHPYPALTPEQK | 0.000 | 0.000 | 0.035 | 0.025 | 0.000 | 0.676 | 0.264 | 0.000 | ||
| 2 spectra, LQSIGTENTEENR | 0.000 | 0.000 | 0.000 | 0.000 | 0.000 | 0.679 | 0.321 | 0.000 | ||
| 2 spectra, ELADIAHR | 0.000 | 0.000 | 0.098 | 0.172 | 0.000 | 0.449 | 0.258 | 0.023 | ||
| 11 spectra, ADDGRPFPQVIK | 0.000 | 0.000 | 0.000 | 0.097 | 0.000 | 0.518 | 0.386 | 0.000 | ||
| 4 spectra, ALQASALK | 0.000 | 0.000 | 0.055 | 0.137 | 0.000 | 0.474 | 0.334 | 0.000 | ||
| 5 spectra, ALANSLACQGK | 0.000 | 0.000 | 0.001 | 0.182 | 0.000 | 0.493 | 0.315 | 0.009 |
| Plot | Mito | Lyso or Perox | ER | Golgi | PM | Cytosol | Nucleus | ||||||
| Expt B |
6 peptides |
11 spectra |
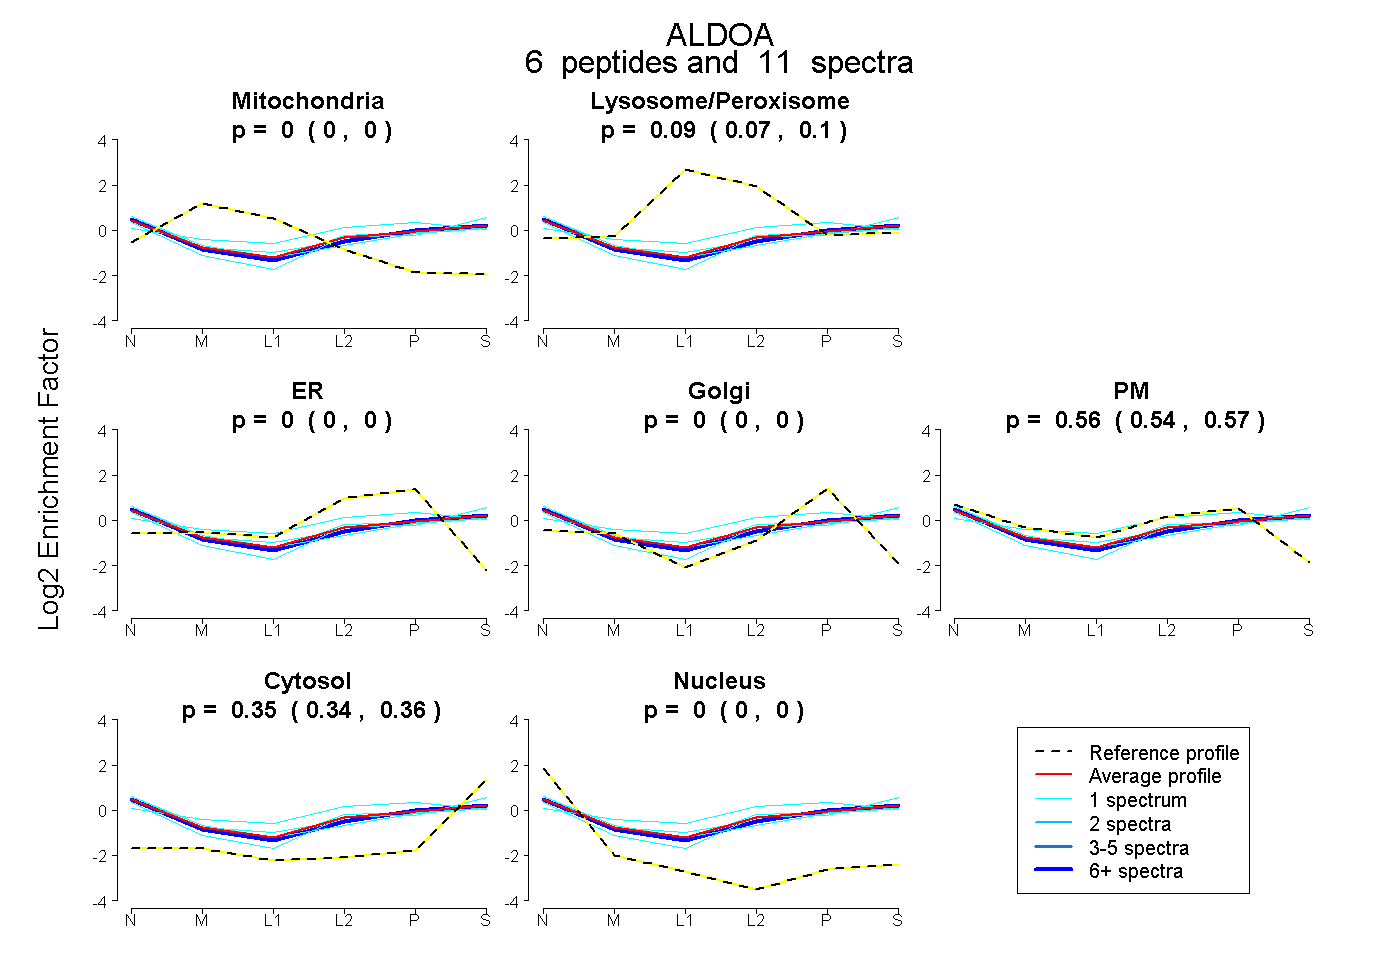 |
0.000 0.000 | 0.000 |
0.088 0.070 | 0.103 |
0.000 0.000 | 0.000 |
0.000 0.000 | 0.000 |
0.557 0.540 | 0.571 |
0.355 0.345 | 0.364 |
0.000 0.000 | 0.000 |
|||
| Plot | Lyso | Other | |||||||||||
| Expt C |
16 peptides |
133 spectra |
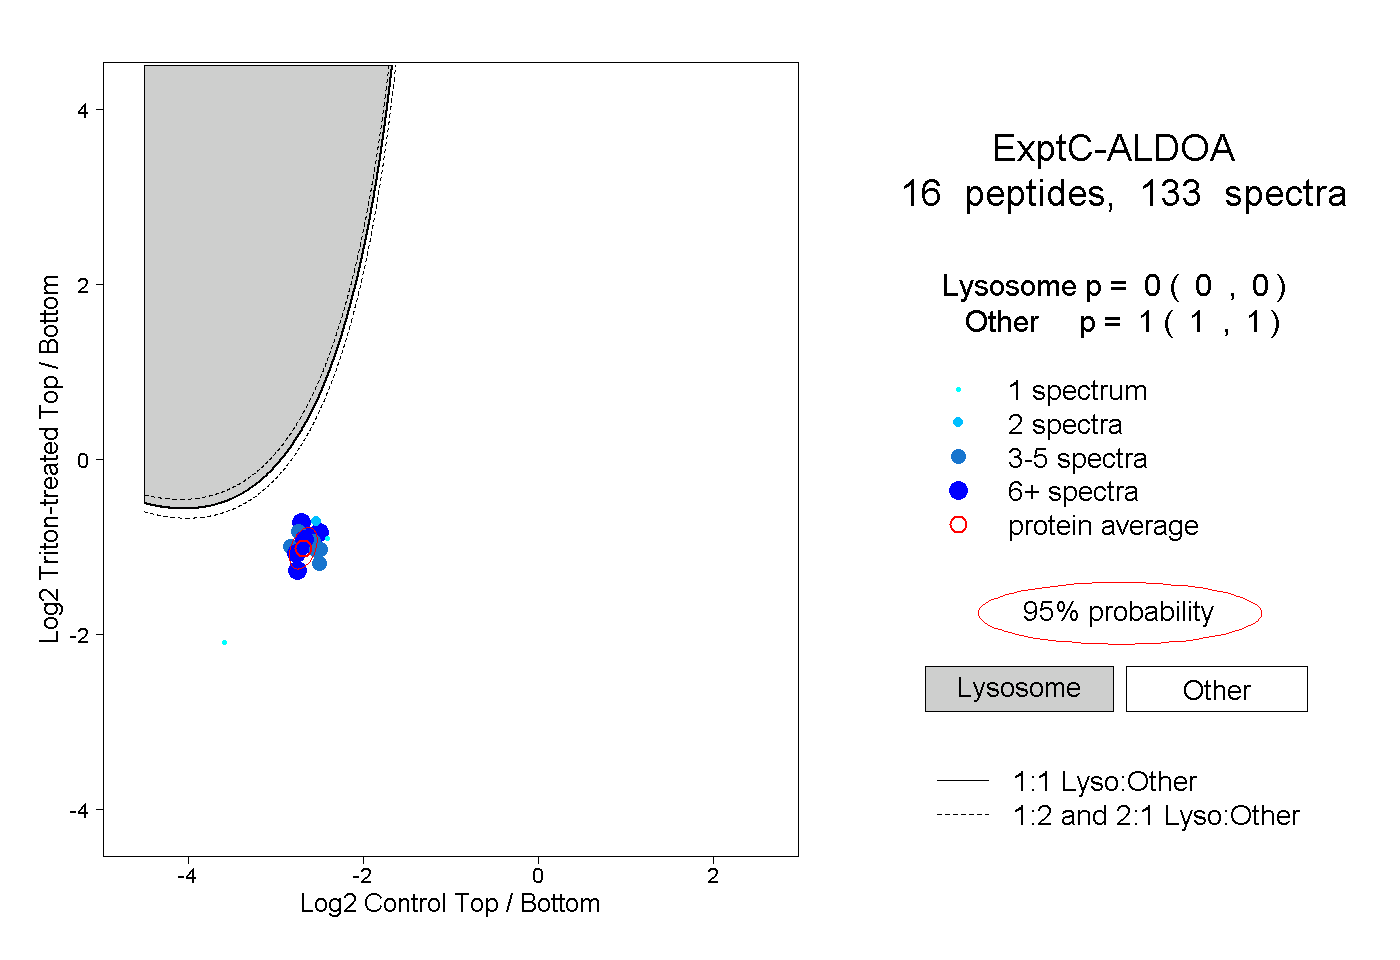 |
0.000 0.000 | 0.000 |
1.000 1.000 | 1.000 |
||||||||
| Plot | Lyso | Other | |||||||||||
| Expt D |
5 peptides |
12 spectra |
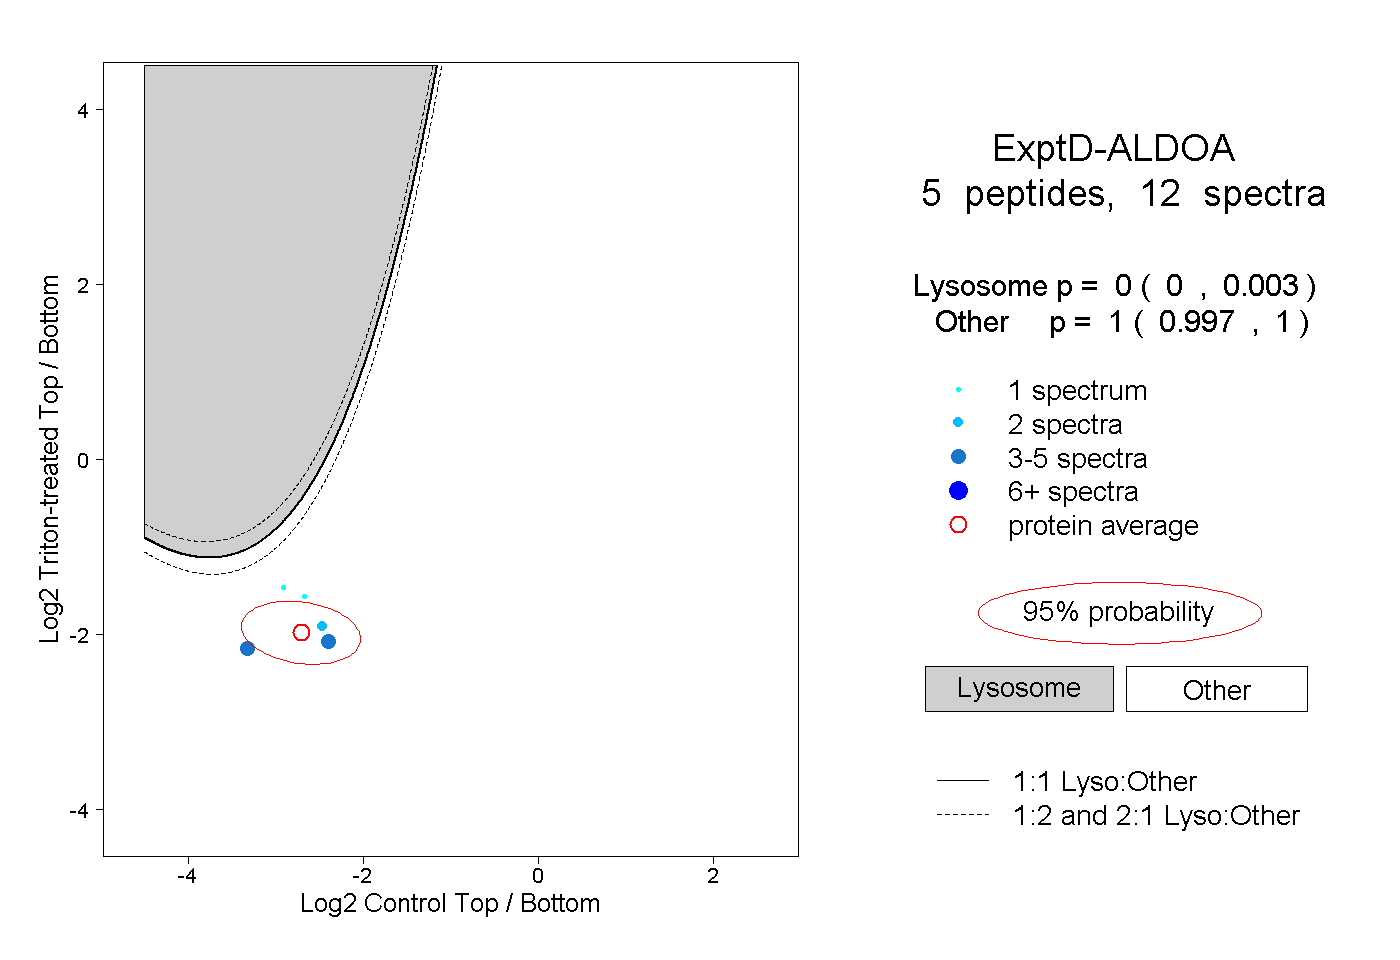 |
0.000 0.000 | 0.003 |
1.000 0.997 | 1.000 |