 5
5peptides
spectra
0.000 | 0.000
0.000 | 0.000
0.000 | 0.000
0.235 | 0.344
0.124 | 0.234
0.000 | 0.000
0.433 | 0.473
0.050 | 0.080
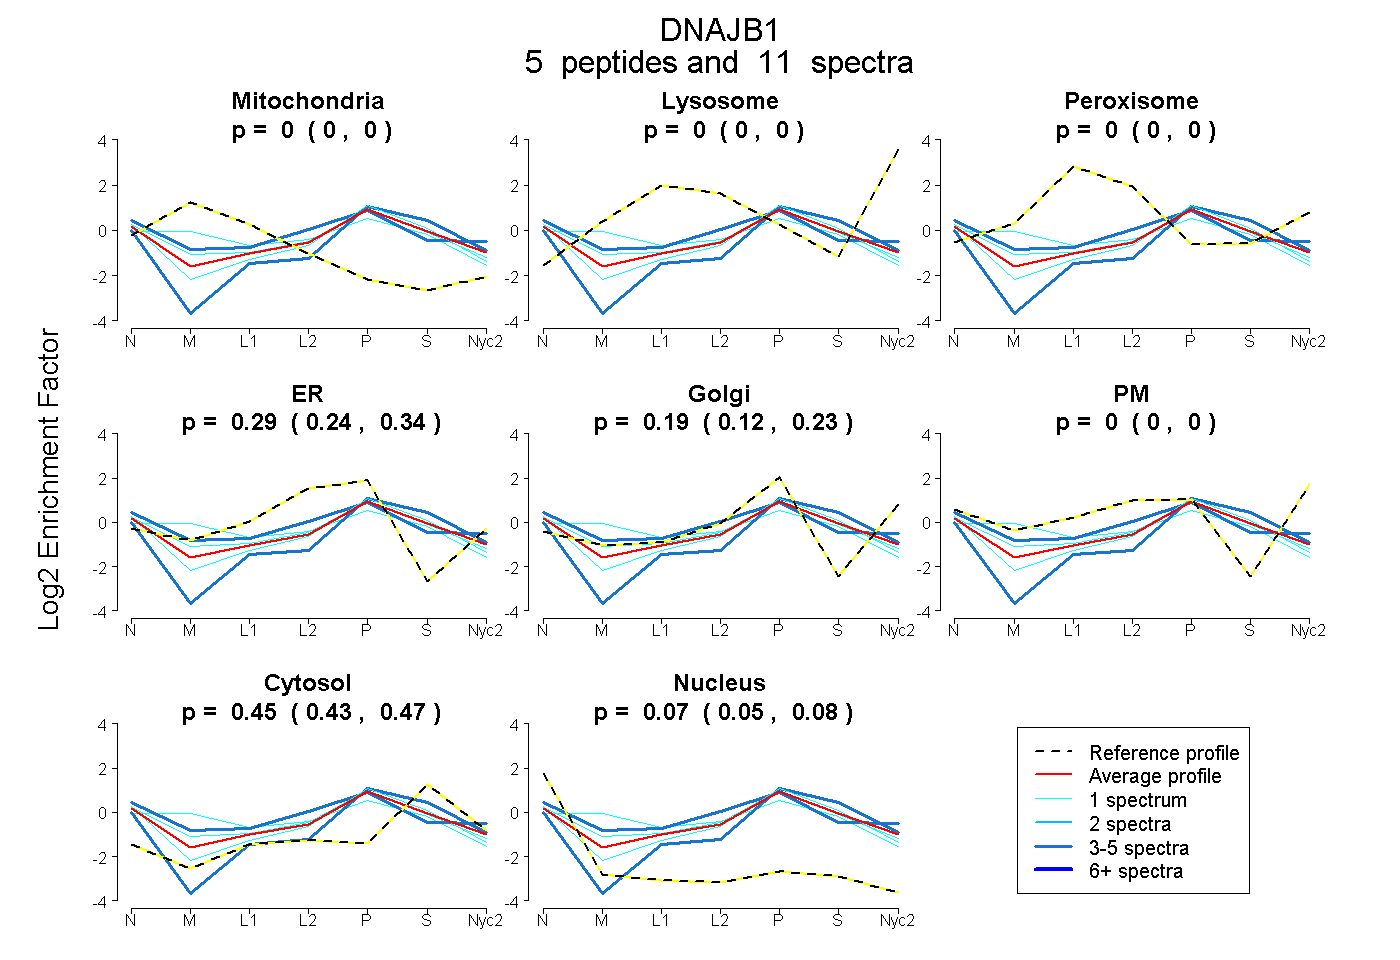
| Plot | Mito | Lyso | Perox | ER | Golgi | PM | Cytosol | Nucleus | |||||
| Expt A |
5 peptides |
11 spectra |
|
0.000 0.000 | 0.000 |
0.000 0.000 | 0.000 |
0.000 0.000 | 0.000 |
0.293 0.235 | 0.344 |
0.185 0.124 | 0.234 |
0.000 0.000 | 0.000 |
0.455 0.433 | 0.473 |
0.067 0.050 | 0.080 |
| 1 spectrum, VSLEEIYSGCTK | 0.000 | 0.000 | 0.000 | 0.274 | 0.149 | 0.000 | 0.470 | 0.106 | ||
| 5 spectra, SRPTQEPTR | 0.000 | 0.000 | 0.000 | 0.353 | 0.000 | 0.245 | 0.354 | 0.048 | ||
| 3 spectra, NPFDTFFGQR | 0.000 | 0.000 | 0.000 | 0.000 | 0.323 | 0.000 | 0.600 | 0.078 | ||
| 1 spectrum, DGSDVIYPAR | 0.000 | 0.000 | 0.000 | 0.395 | 0.105 | 0.000 | 0.422 | 0.077 | ||
| 1 spectrum, ILTIEVK | 0.246 | 0.000 | 0.000 | 0.374 | 0.000 | 0.000 | 0.380 | 0.000 |
| Plot | Mito | Lyso or Perox | ER | Golgi | PM | Cytosol | Nucleus | ||||||
| Expt B |
2 peptides |
2 spectra |
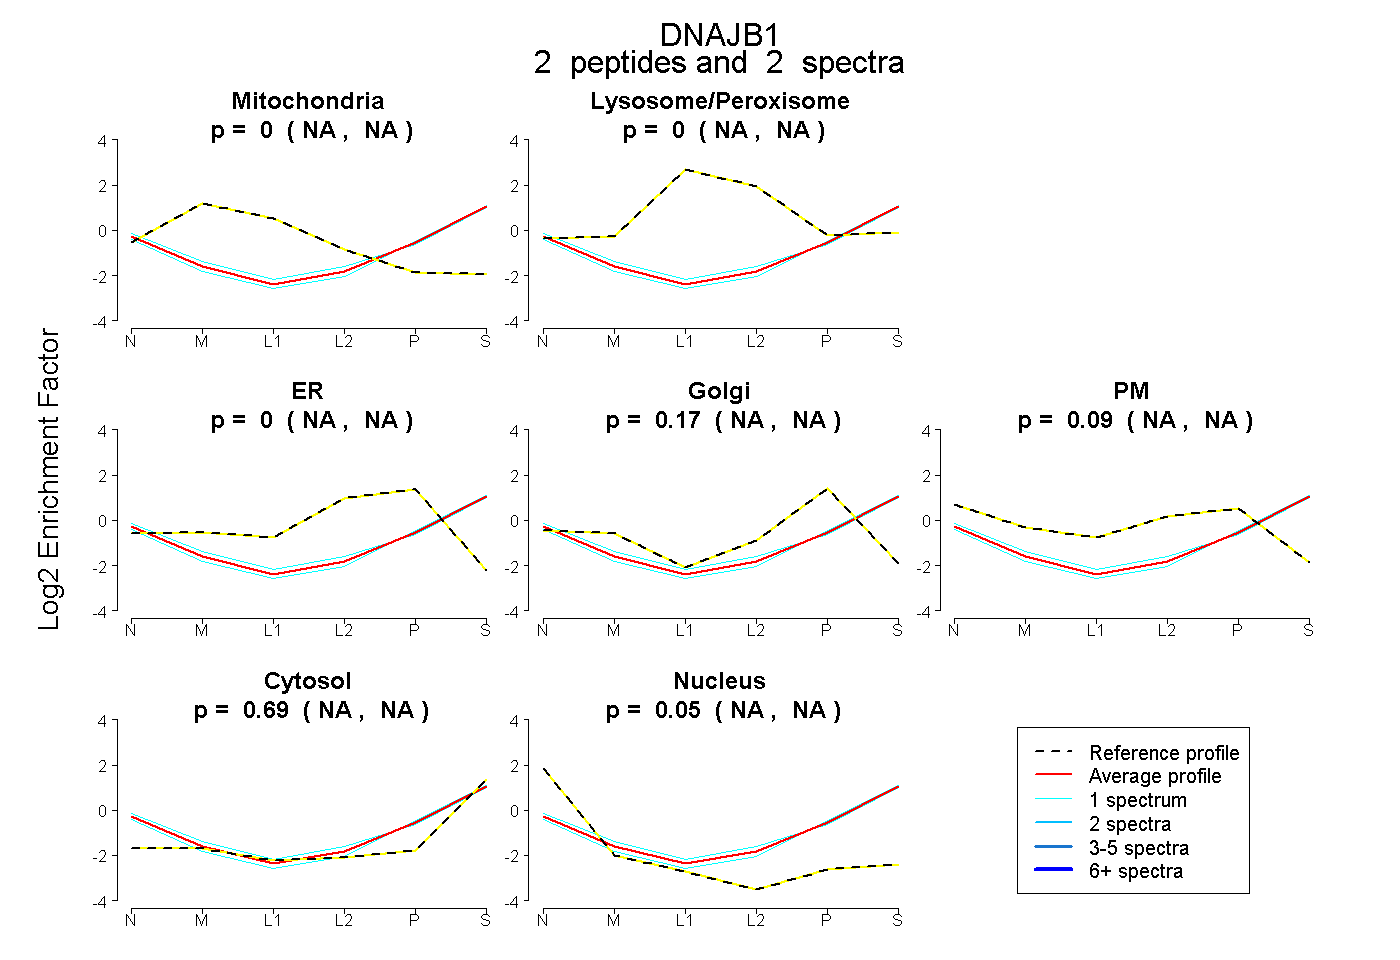 |
0.000 NA | NA |
0.000 NA | NA |
0.000 NA | NA |
0.167 NA | NA |
0.090 NA | NA |
0.690 NA | NA |
0.053 NA | NA |
|||
| Plot | Lyso | Other | |||||||||||
| Expt C |
6 peptides |
9 spectra |
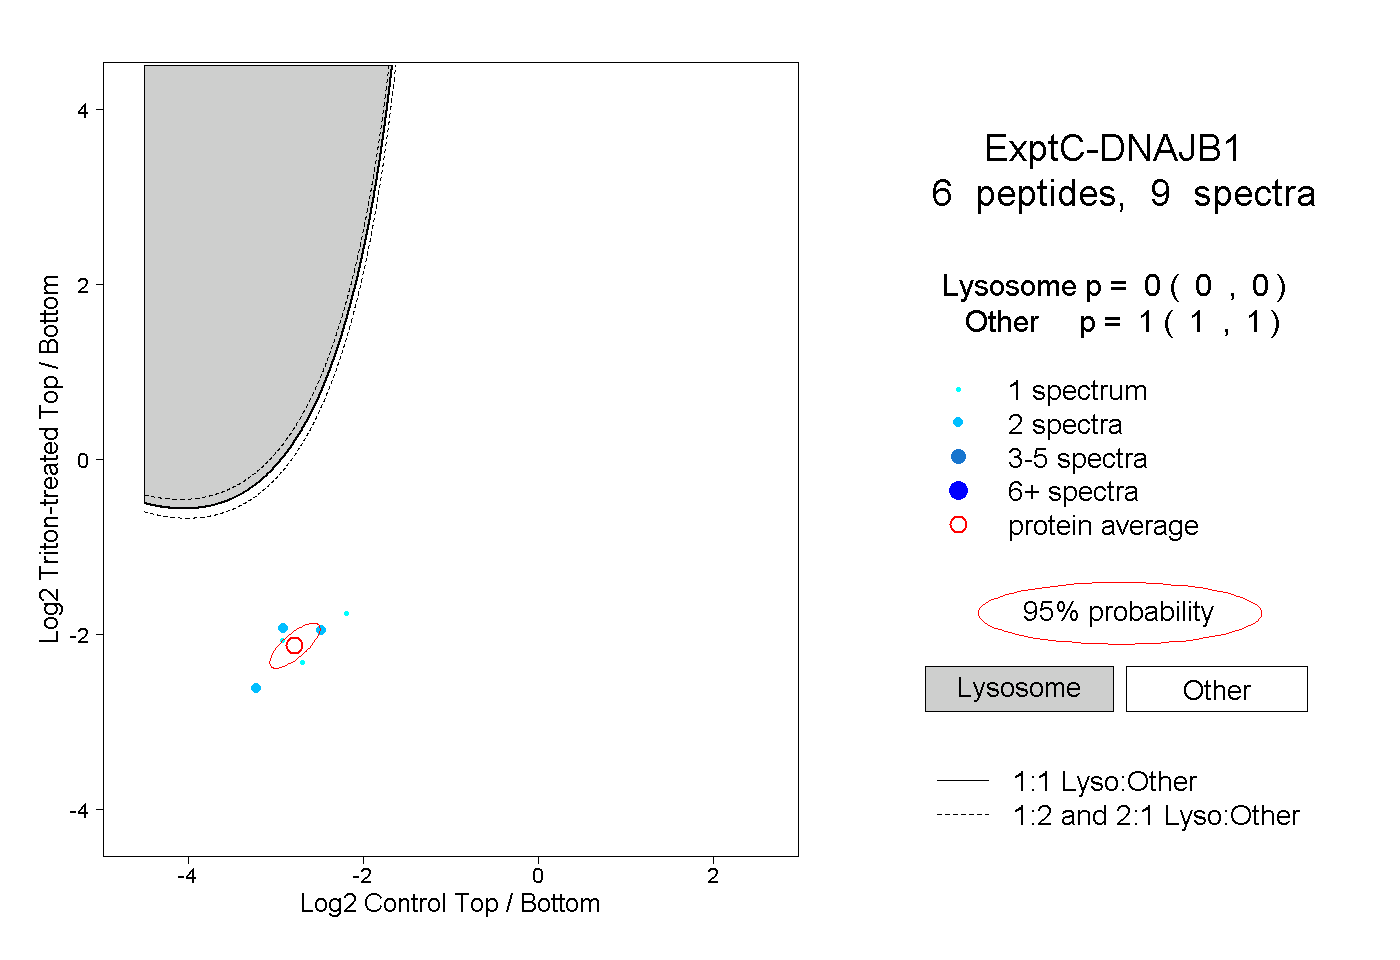 |
0.000 0.000 | 0.000 |
1.000 1.000 | 1.000 |
||||||||
| Plot | Lyso | Other | |||||||||||
| Expt D |
2 peptides |
3 spectra |
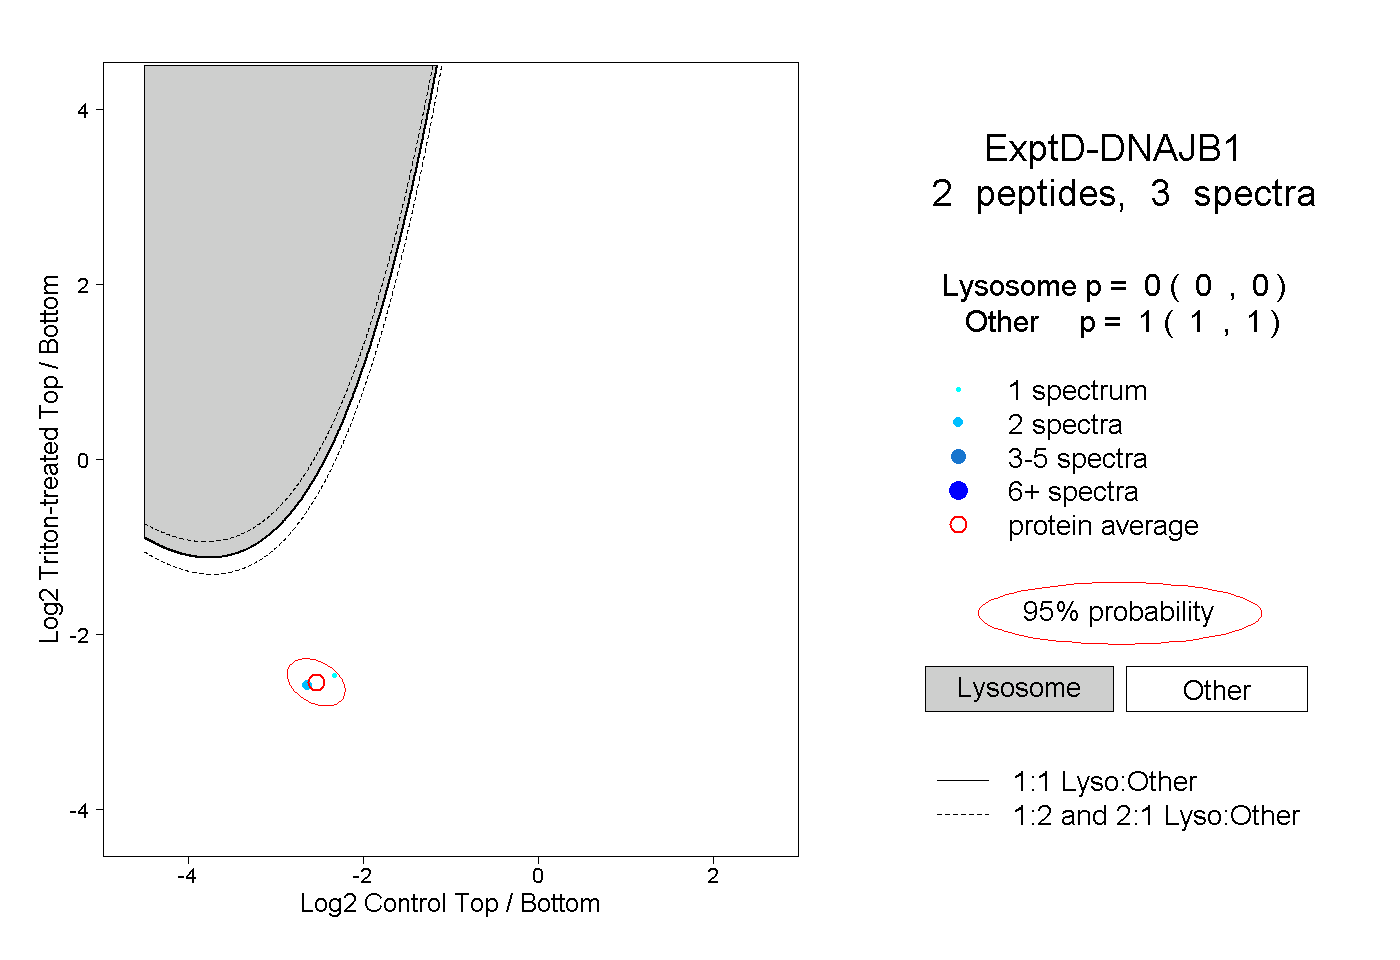 |
0.000 0.000 | 0.000 |
1.000 1.000 | 1.000 |