 1
1peptide
spectrum
NA | NA
NA | NA
NA | NA
NA | NA
NA | NA
NA | NA
NA | NA
NA | NA
1peptide
spectra
NA | NA
NA | NA
NA | NA
NA | NA
NA | NA
NA | NA
NA | NA
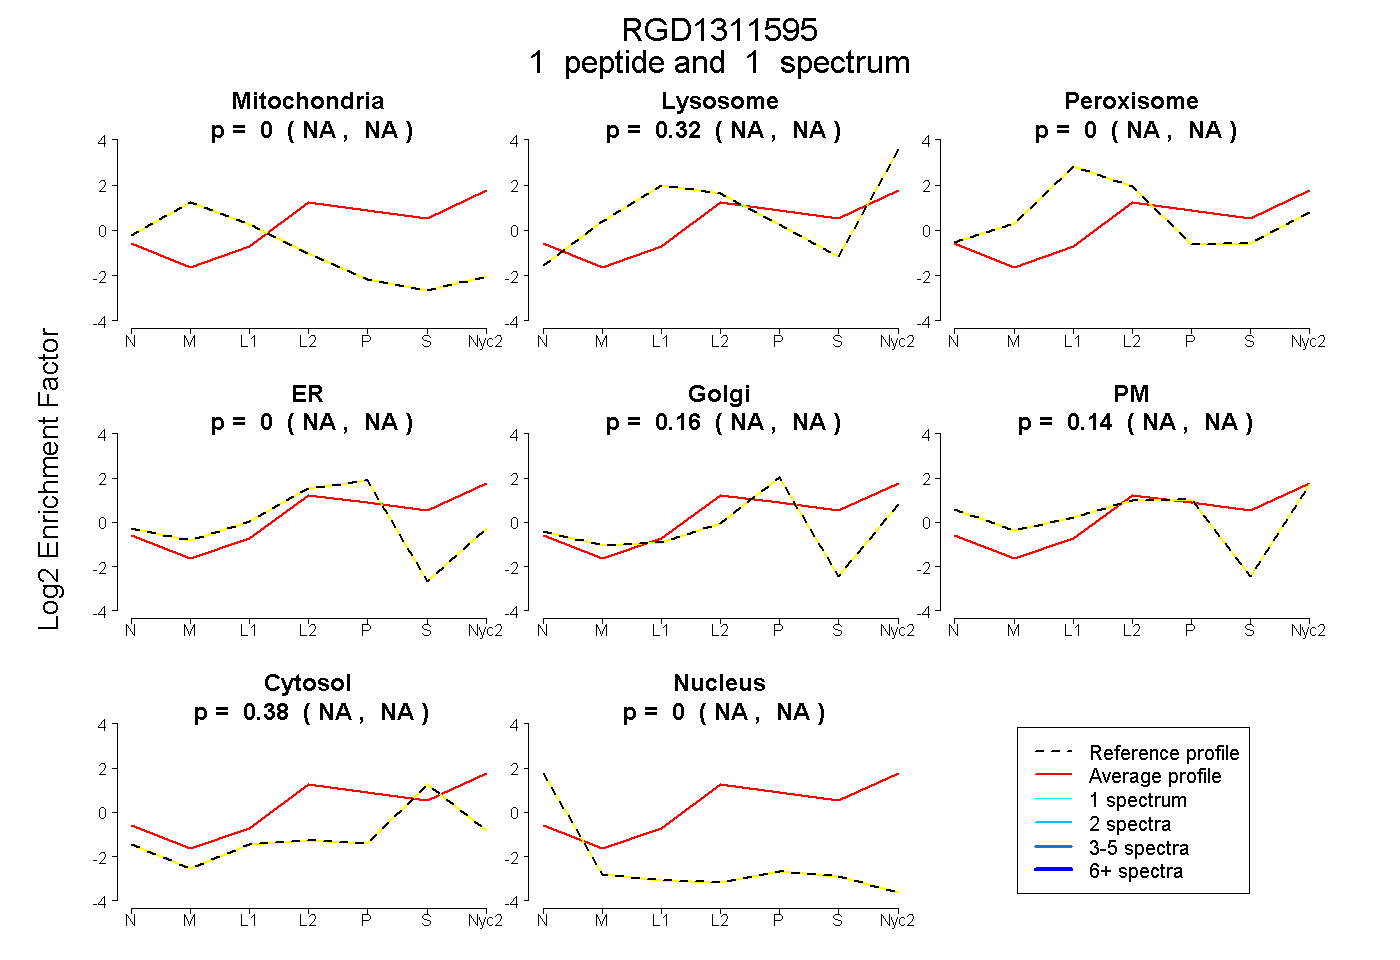
| Plot | Mito | Lyso | Perox | ER | Golgi | PM | Cytosol | Nucleus | |||||
| Expt A |
1 peptide |
1 spectrum |
|
0.000 NA | NA |
0.322 NA | NA |
0.000 NA | NA |
0.000 NA | NA |
0.156 NA | NA |
0.145 NA | NA |
0.378 NA | NA |
0.000 NA | NA |
||
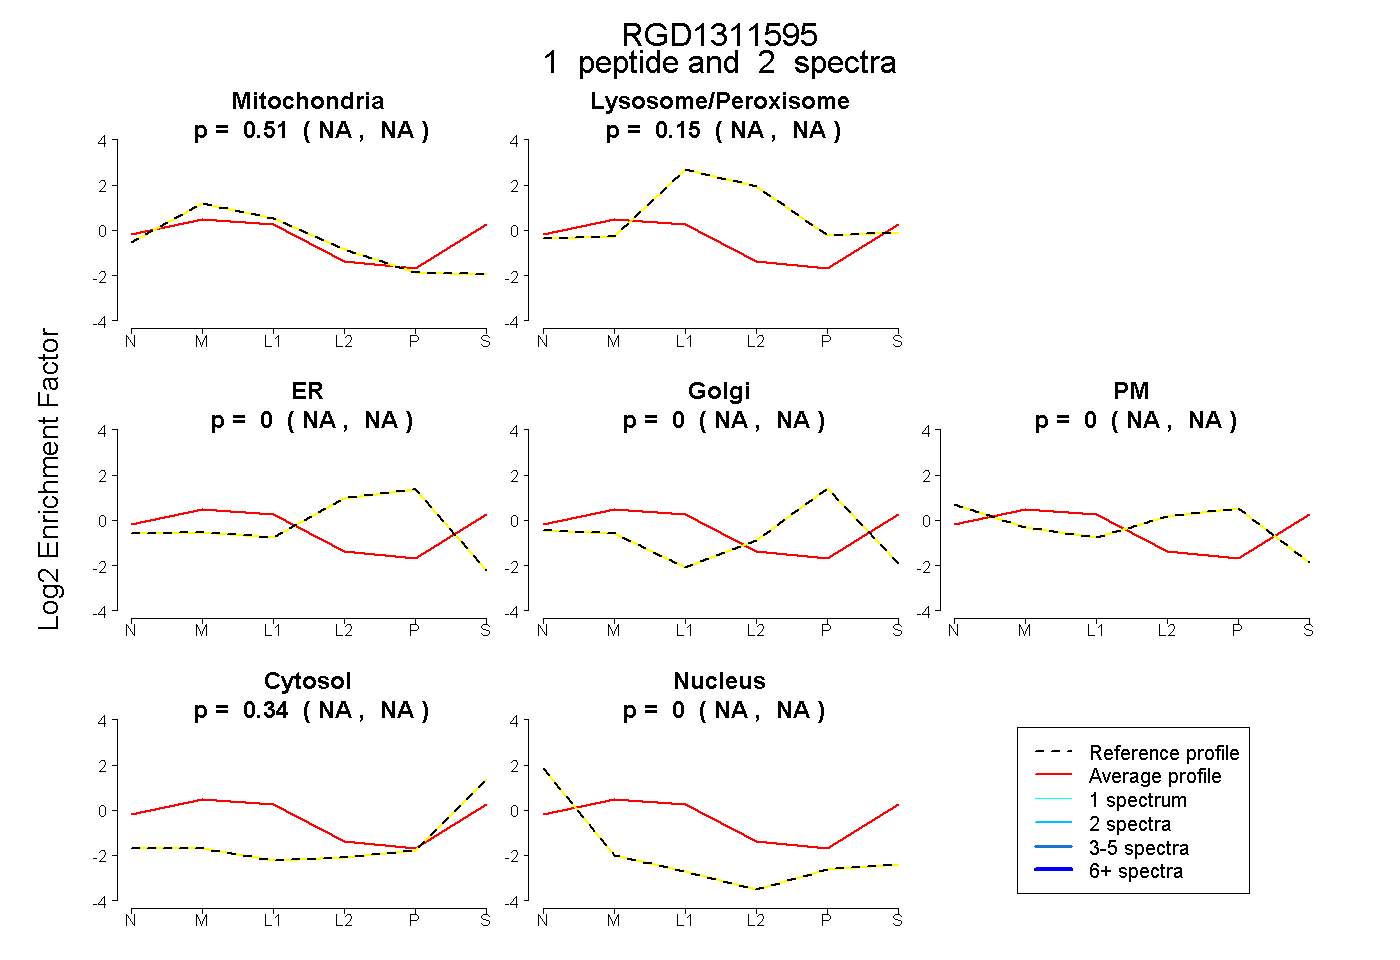
| Plot | Mito | Lyso or Perox | ER | Golgi | PM | Cytosol | Nucleus | ||||||
| Expt B |
1 peptide |
2 spectra |
|
0.508 NA | NA |
0.146 NA | NA |
0.000 NA | NA |
0.000 NA | NA |
0.000 NA | NA |
0.344 NA | NA |
0.001 NA | NA |