 4
4peptides
spectra
0.000 | 0.005
0.000 | 0.000
0.000 | 0.017
0.745 | 0.915
0.000 | 0.000
0.000 | 0.151
0.000 | 0.000
0.062 | 0.123
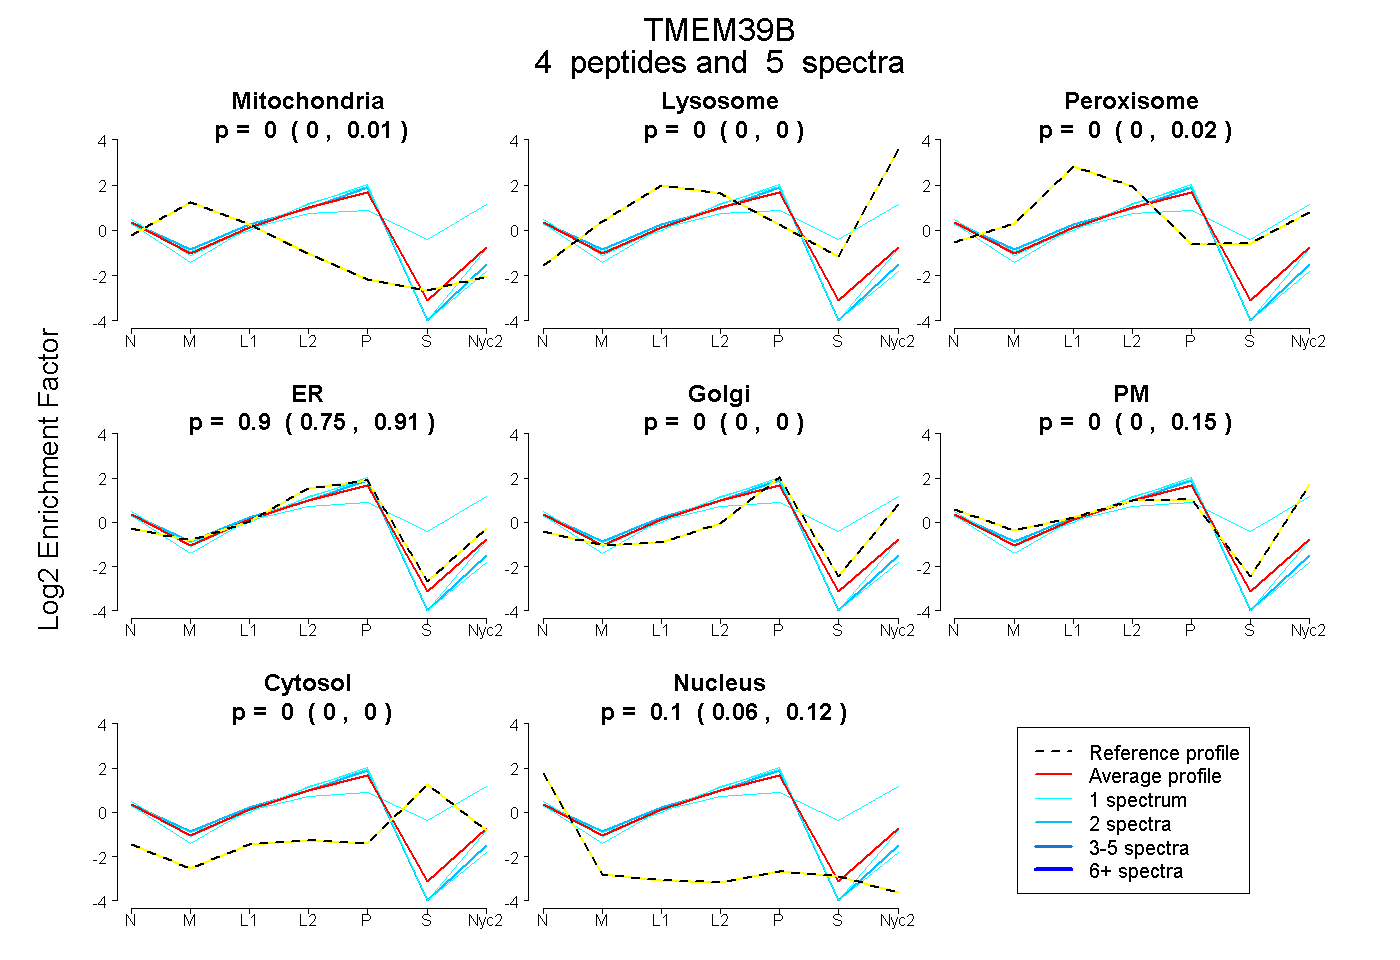
| Plot | Mito | Lyso | Perox | ER | Golgi | PM | Cytosol | Nucleus | |||||
| Expt A |
4 peptides |
5 spectra |
|
0.000 0.000 | 0.005 |
0.000 0.000 | 0.000 |
0.000 0.000 | 0.017 |
0.905 0.745 | 0.915 |
0.000 0.000 | 0.000 |
0.000 0.000 | 0.151 |
0.000 0.000 | 0.000 |
0.095 0.062 | 0.123 |
| 1 spectrum, EAVSGLAR | 0.000 | 0.000 | 0.000 | 0.874 | 0.000 | 0.000 | 0.000 | 0.126 | ||
| 1 spectrum, SILLFLTR | 0.000 | 0.000 | 0.000 | 0.925 | 0.000 | 0.000 | 0.000 | 0.075 | ||
| 2 spectra, AYSYSASPQR | 0.008 | 0.000 | 0.000 | 0.885 | 0.000 | 0.000 | 0.000 | 0.107 | ||
| 1 spectrum, NEVEFLK | 0.000 | 0.000 | 0.106 | 0.000 | 0.000 | 0.632 | 0.262 | 0.000 |