 6
6peptides
spectra
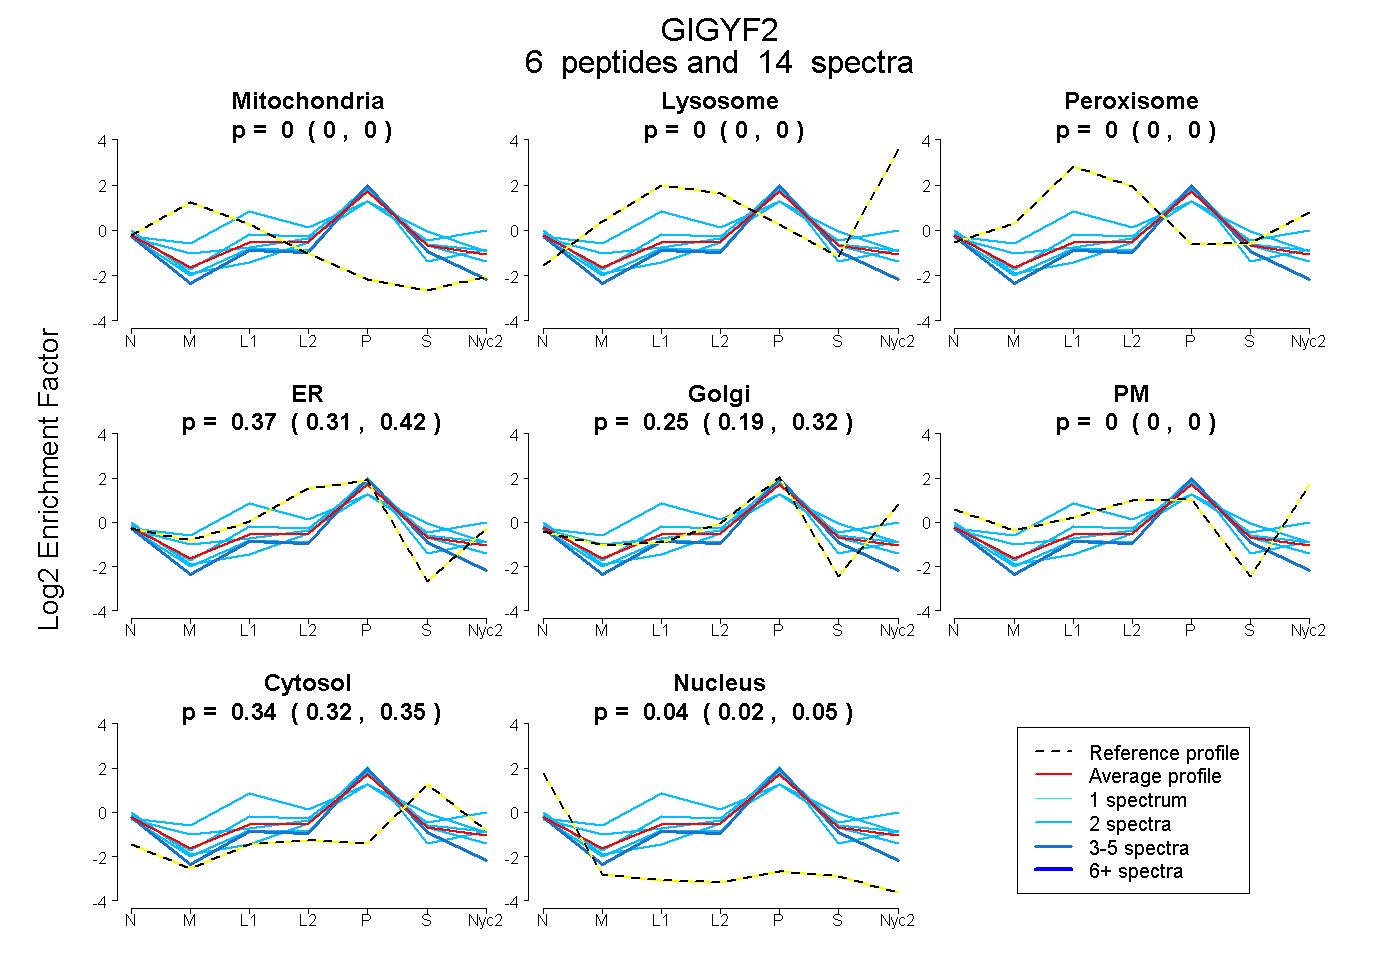
0.000 | 0.000
0.000 | 0.000
0.000 | 0.000
0.309 | 0.420
0.190 | 0.316
0.000 | 0.000
0.317 | 0.352
0.021 | 0.053
1peptide
spectrum
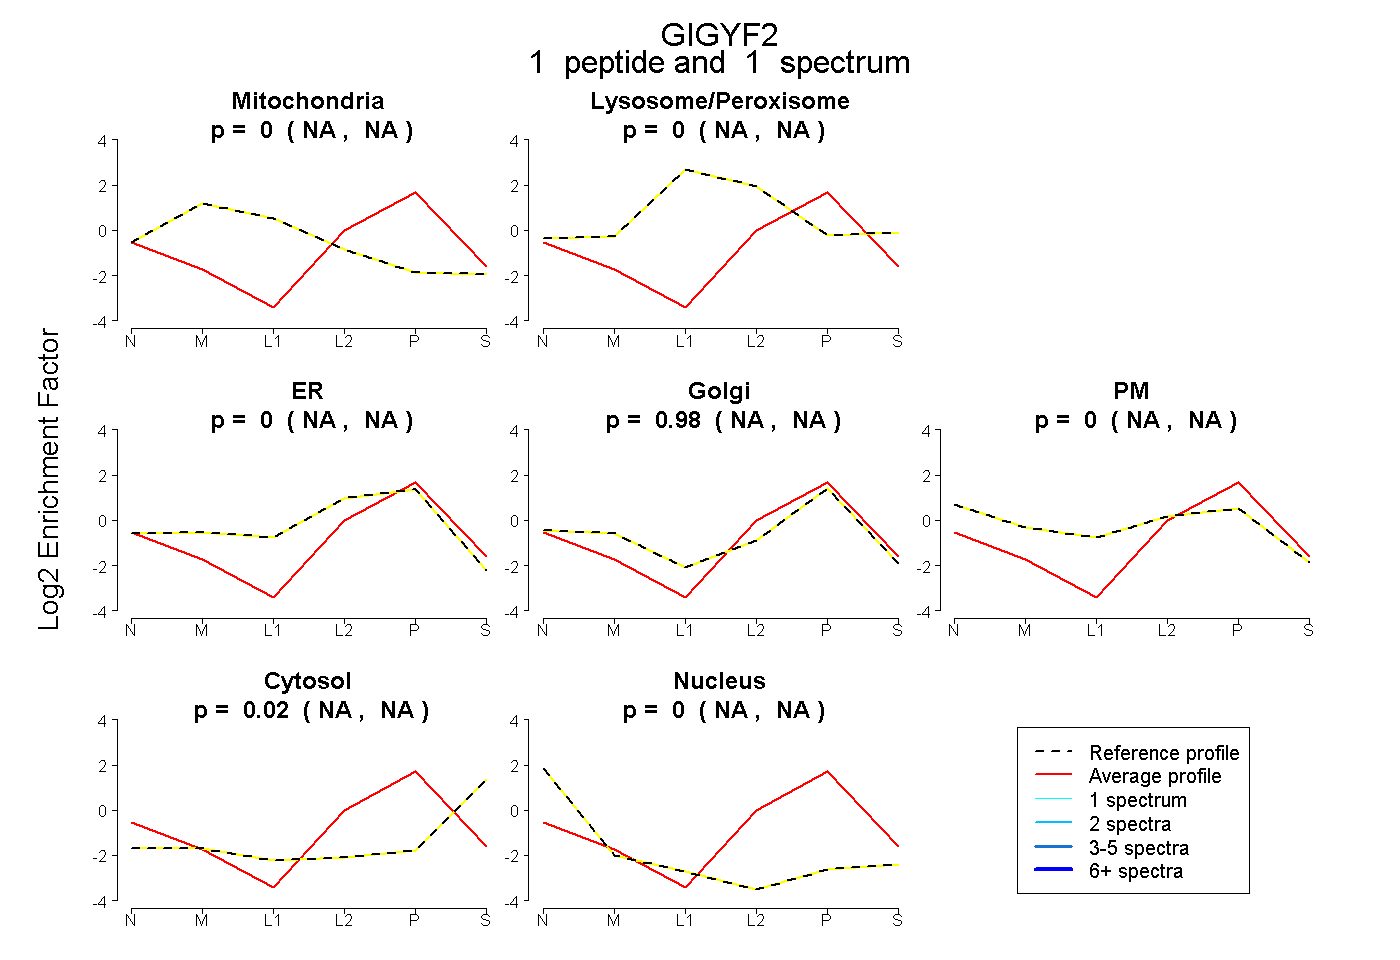
NA | NA
NA | NA
NA | NA
NA | NA
NA | NA
NA | NA
NA | NA
1peptide
spectra
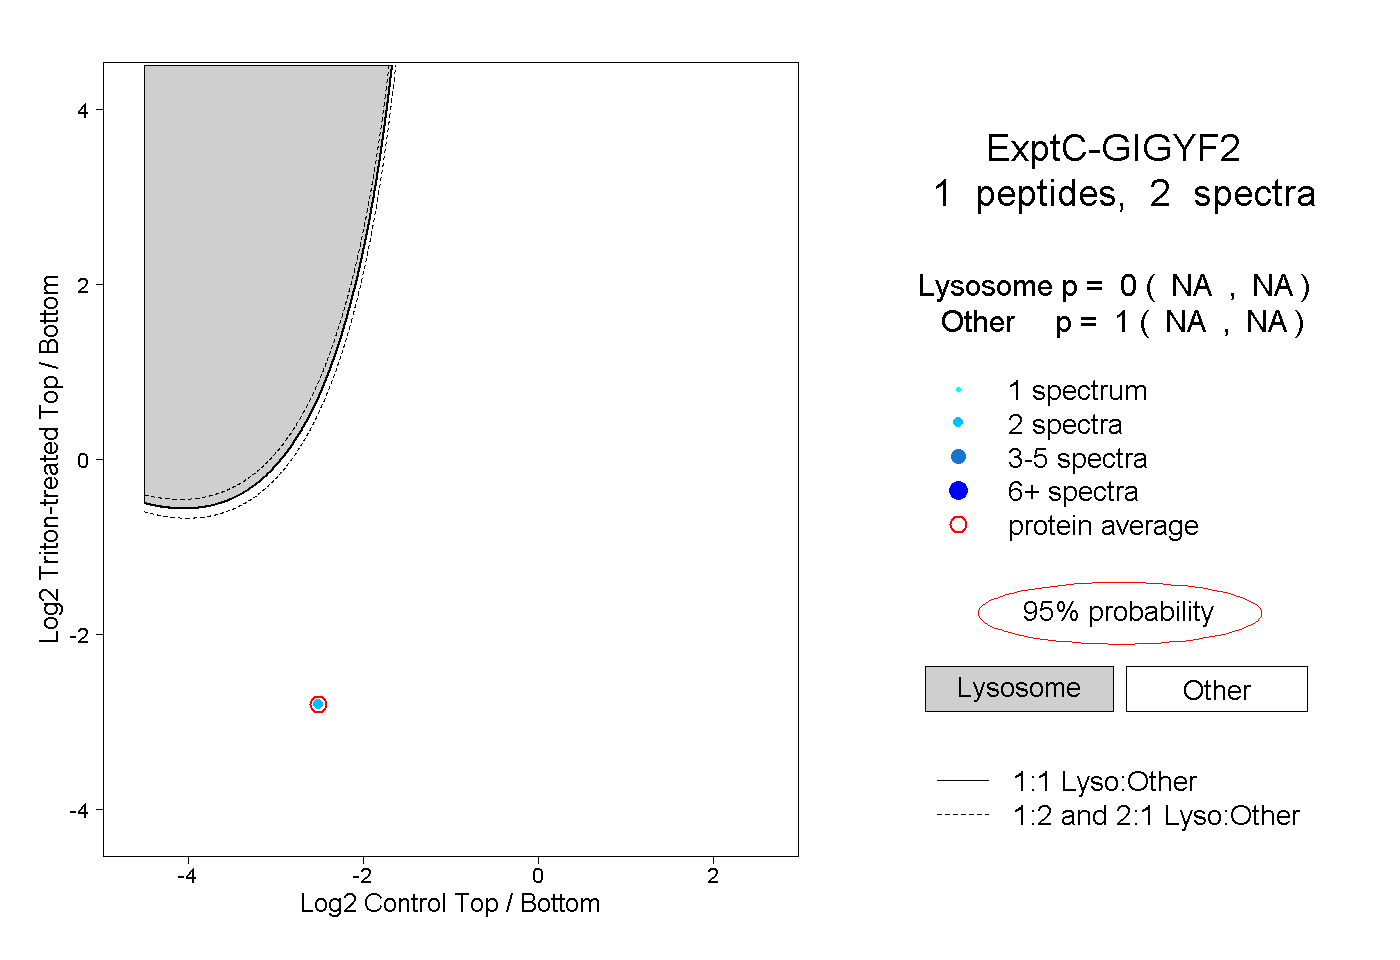
NA | NA
NA | NA