 5
5peptides
spectra
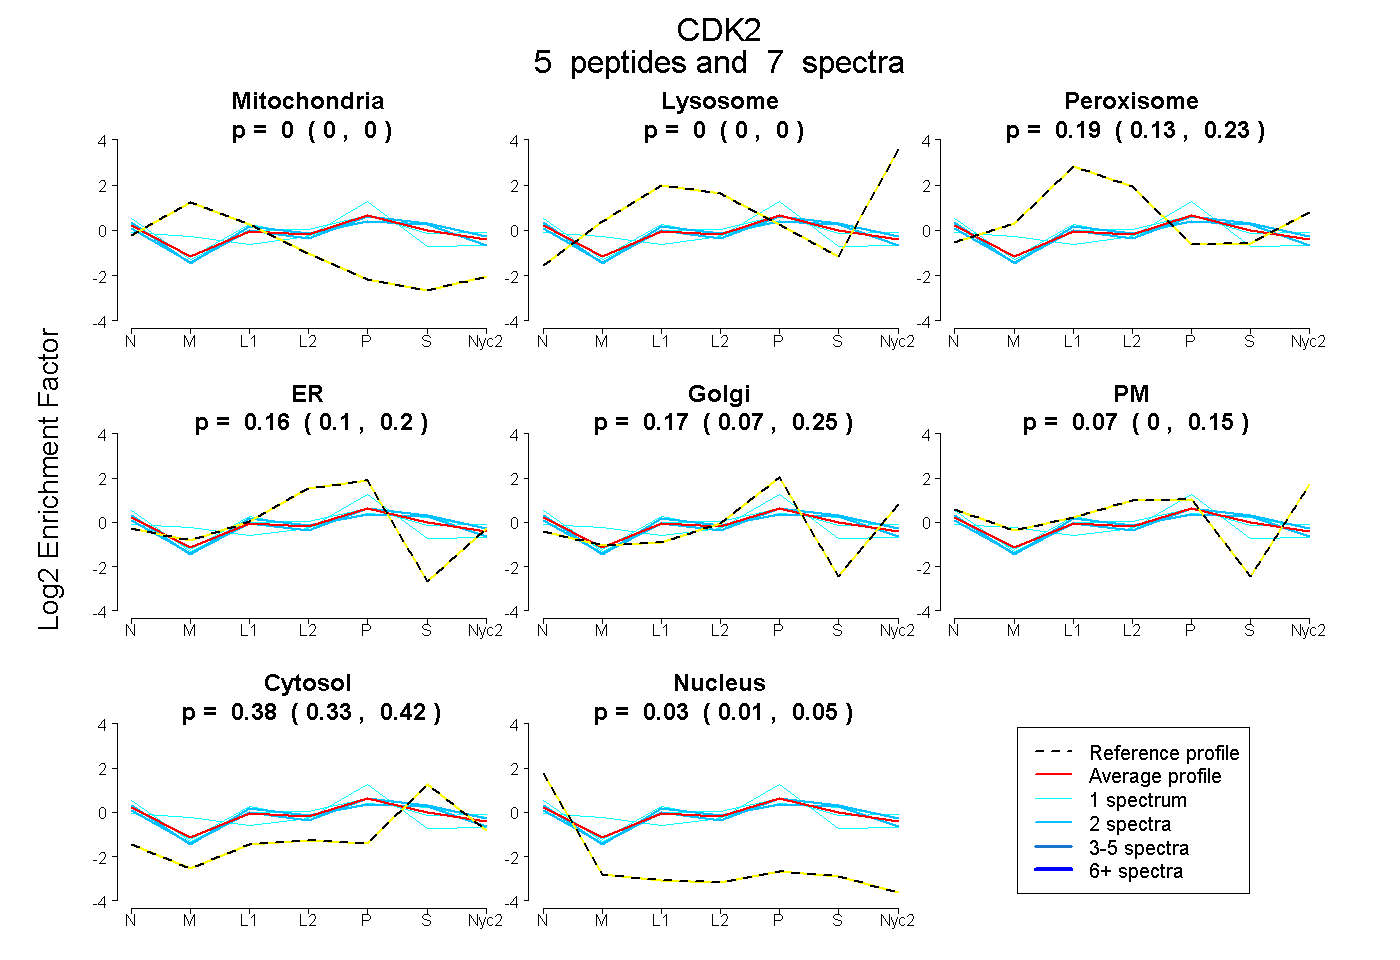
0.000 | 0.000
0.000 | 0.000
0.131 | 0.235
0.097 | 0.204
0.066 | 0.250
0.000 | 0.145
0.334 | 0.423
0.014 | 0.051
1peptide
spectrum
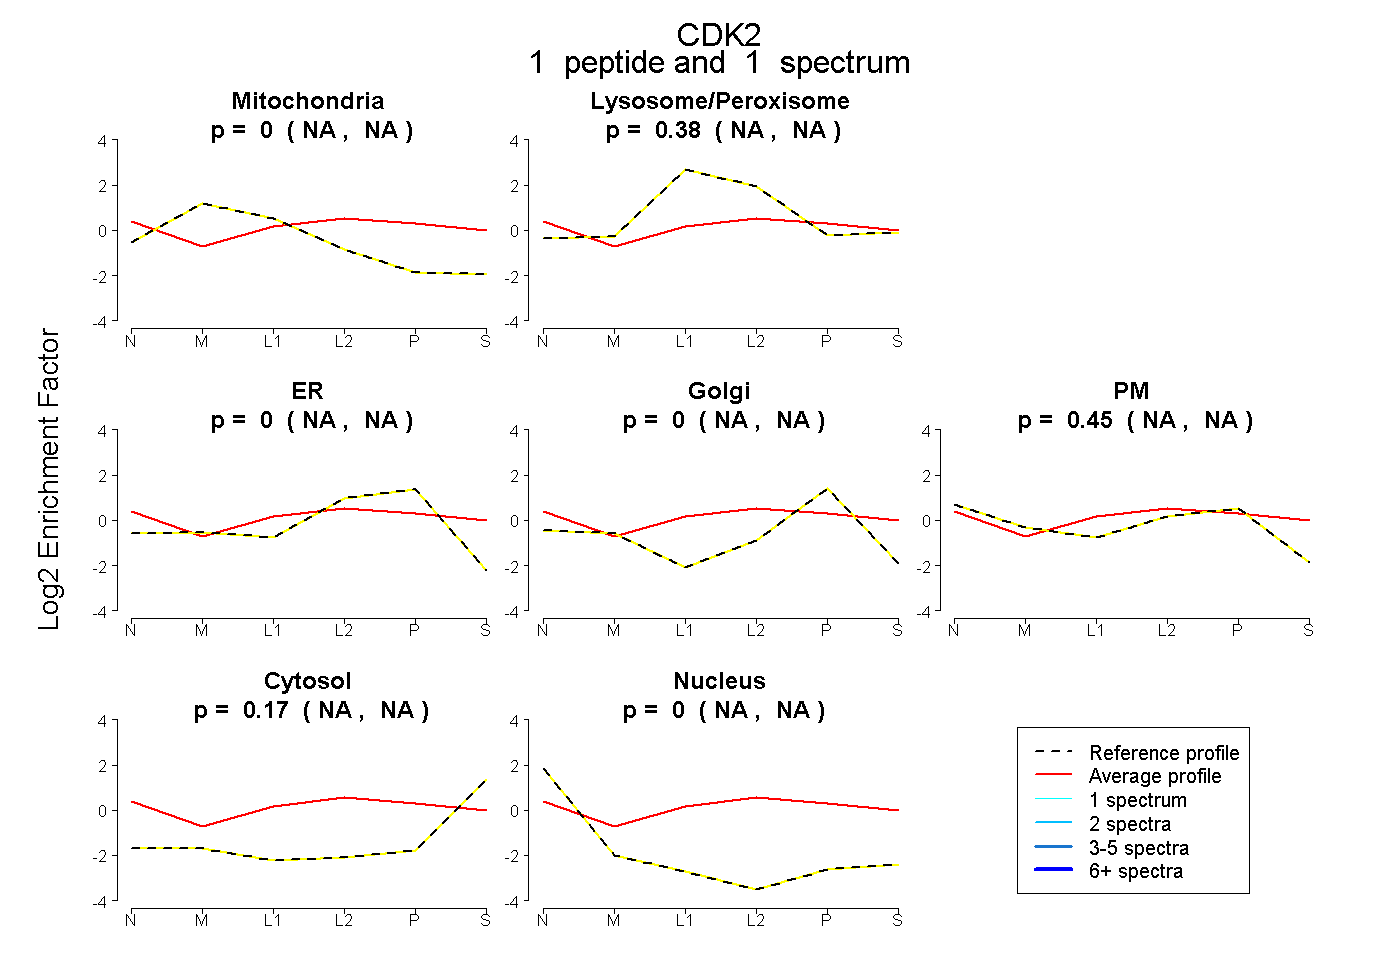
NA | NA
NA | NA
NA | NA
NA | NA
NA | NA
NA | NA
NA | NA
5peptides
spectra
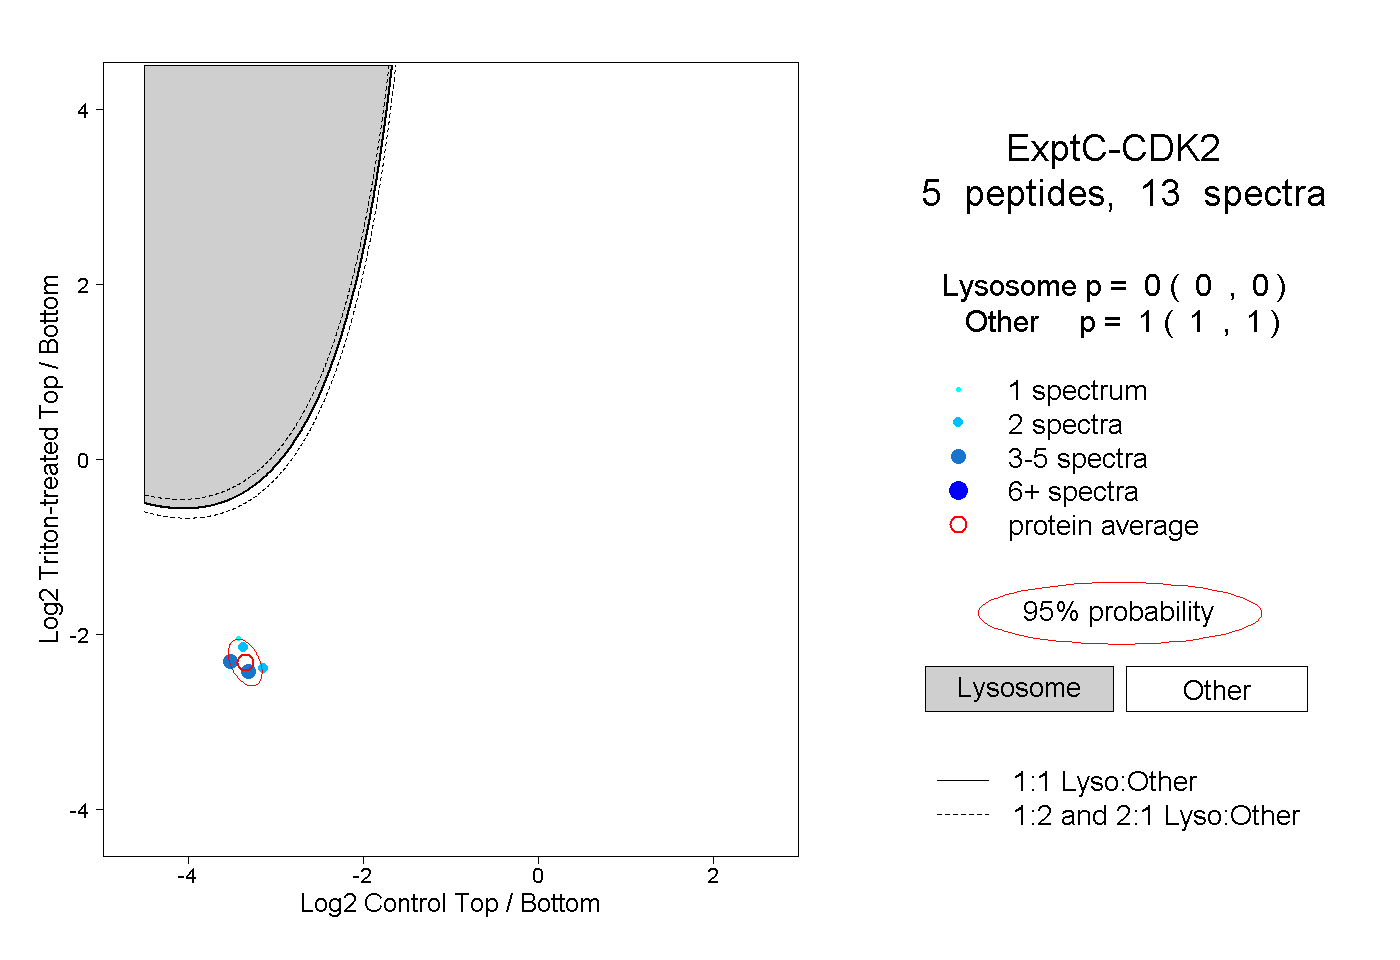
0.000 | 0.000
1.000 | 1.000
