 5
5peptides
spectra
0.000 | 0.000
0.000 | 0.000
0.131 | 0.235
0.097 | 0.204
0.066 | 0.250
0.000 | 0.145
0.334 | 0.423
0.014 | 0.051
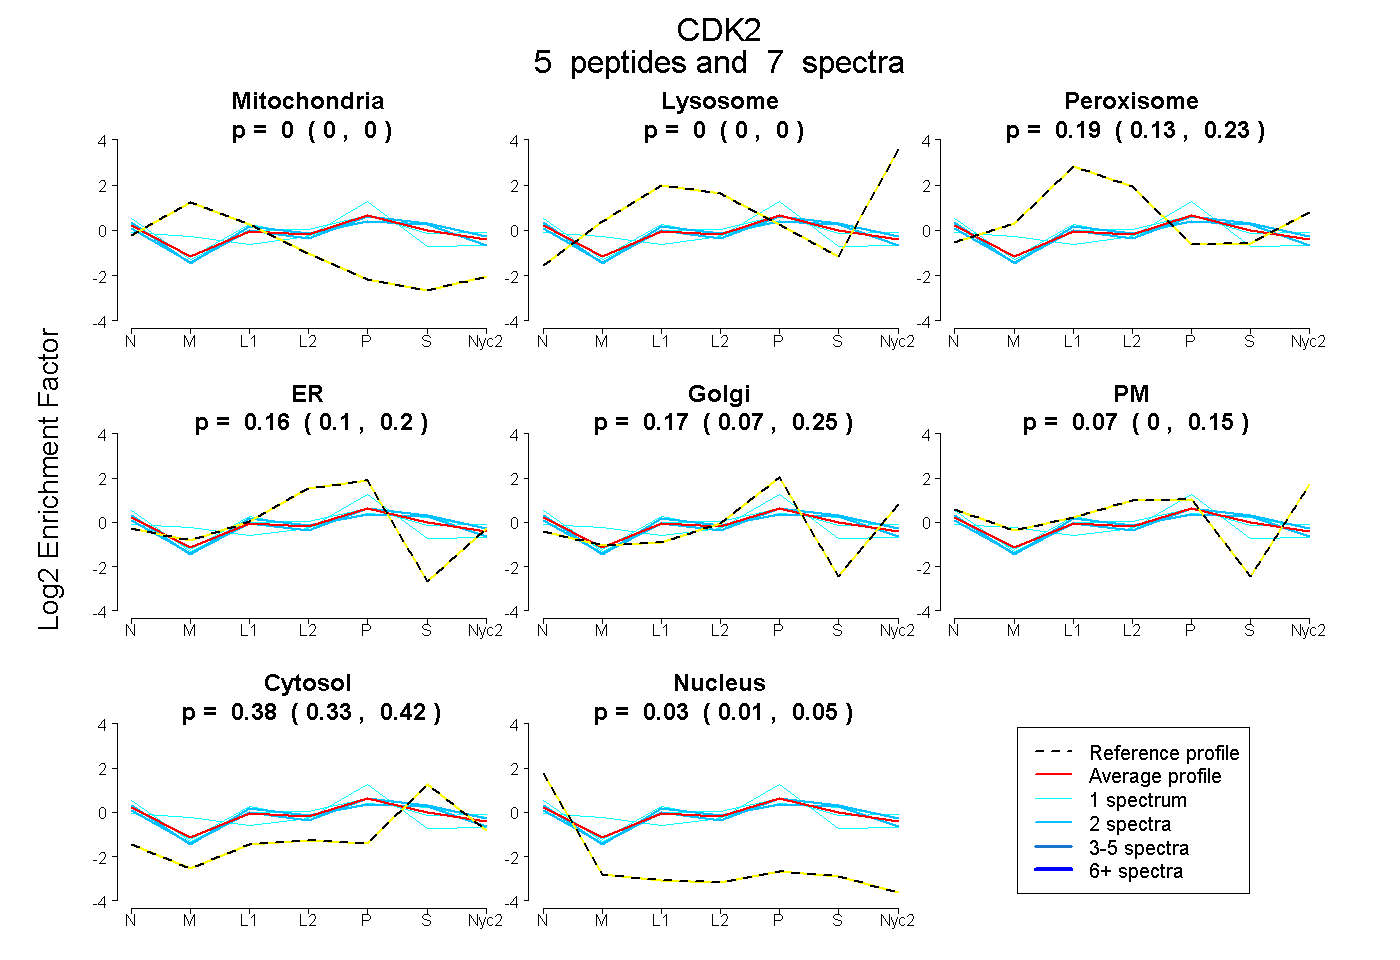
| Plot | Mito | Lyso | Perox | ER | Golgi | PM | Cytosol | Nucleus | |||||
| Expt A |
5 peptides |
7 spectra |
|
0.000 0.000 | 0.000 |
0.000 0.000 | 0.000 |
0.187 0.131 | 0.235 |
0.156 0.097 | 0.204 |
0.167 0.066 | 0.250 |
0.074 0.000 | 0.145 |
0.382 0.334 | 0.423 |
0.034 0.014 | 0.051 |
| 1 spectrum, ELNHPNIVK | 0.000 | 0.000 | 0.098 | 0.170 | 0.000 | 0.323 | 0.390 | 0.019 | ||
| 2 spectra, LLDVIHTENK | 0.000 | 0.000 | 0.181 | 0.078 | 0.227 | 0.058 | 0.456 | 0.000 | ||
| 2 spectra, VVPPLDEDGR | 0.000 | 0.000 | 0.212 | 0.247 | 0.000 | 0.055 | 0.439 | 0.048 | ||
| 1 spectrum, AALAHPFFQDVTKPVPHLR | 0.134 | 0.000 | 0.020 | 0.251 | 0.350 | 0.000 | 0.245 | 0.000 | ||
| 1 spectrum, LDTETEGVPSTAIR | 0.000 | 0.000 | 0.258 | 0.055 | 0.142 | 0.113 | 0.404 | 0.029 |
| Plot | Mito | Lyso or Perox | ER | Golgi | PM | Cytosol | Nucleus | ||||||
| Expt B |
1 peptide |
1 spectrum |
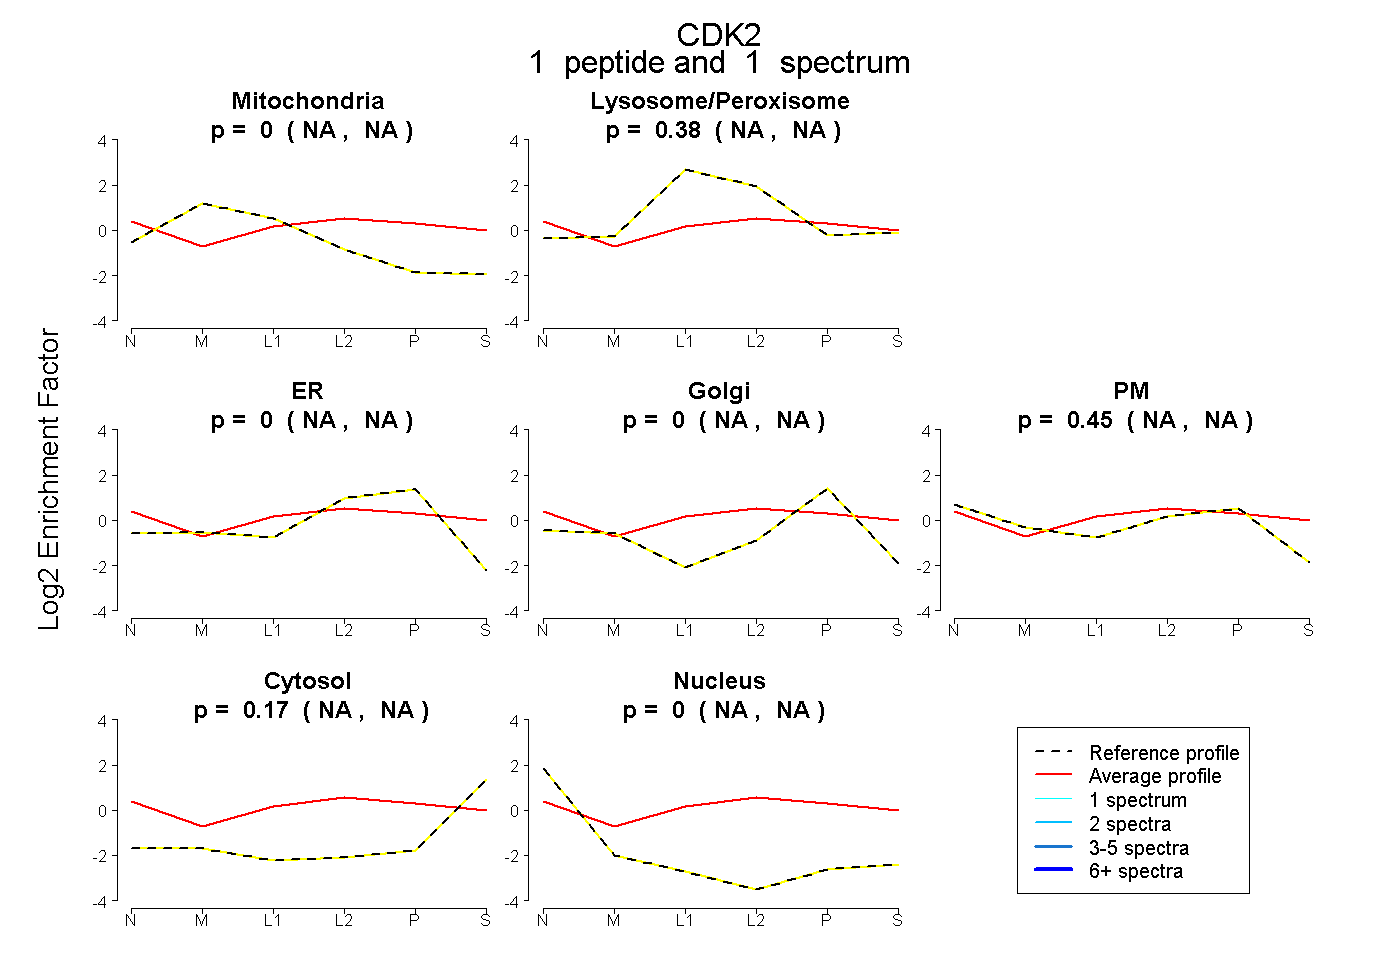 |
0.000 NA | NA |
0.377 NA | NA |
0.000 NA | NA |
0.000 NA | NA |
0.449 NA | NA |
0.174 NA | NA |
0.000 NA | NA |
|||
| Plot | Lyso | Other | |||||||||||
| Expt C |
5 peptides |
13 spectra |
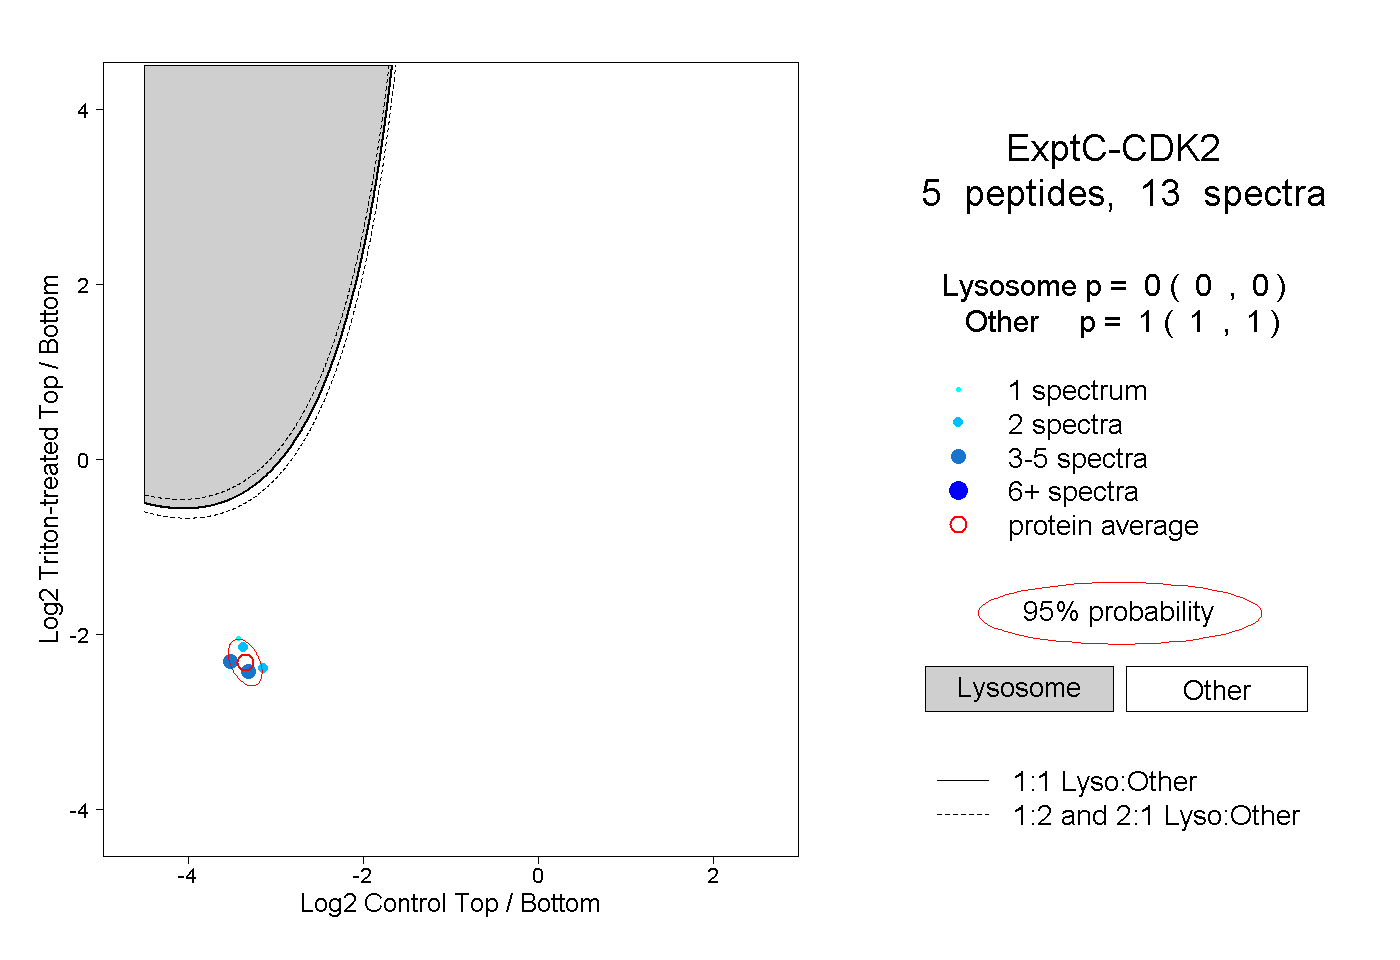 |
0.000 0.000 | 0.000 |
1.000 1.000 | 1.000 |
||||||||
| Plot | Lyso | Other | |||||||||||
| Expt D |
2 peptides |
3 spectra |
 |
0.000 0.000 | 0.000 |
1.000 1.000 | 1.000 |