 2
2peptides
spectra
0.000 | 0.064
0.185 | 0.637
0.000 | 0.326
0.000 | 0.105
0.000 | 0.379
0.000 | 0.322
0.009 | 0.225
0.000 | 0.000
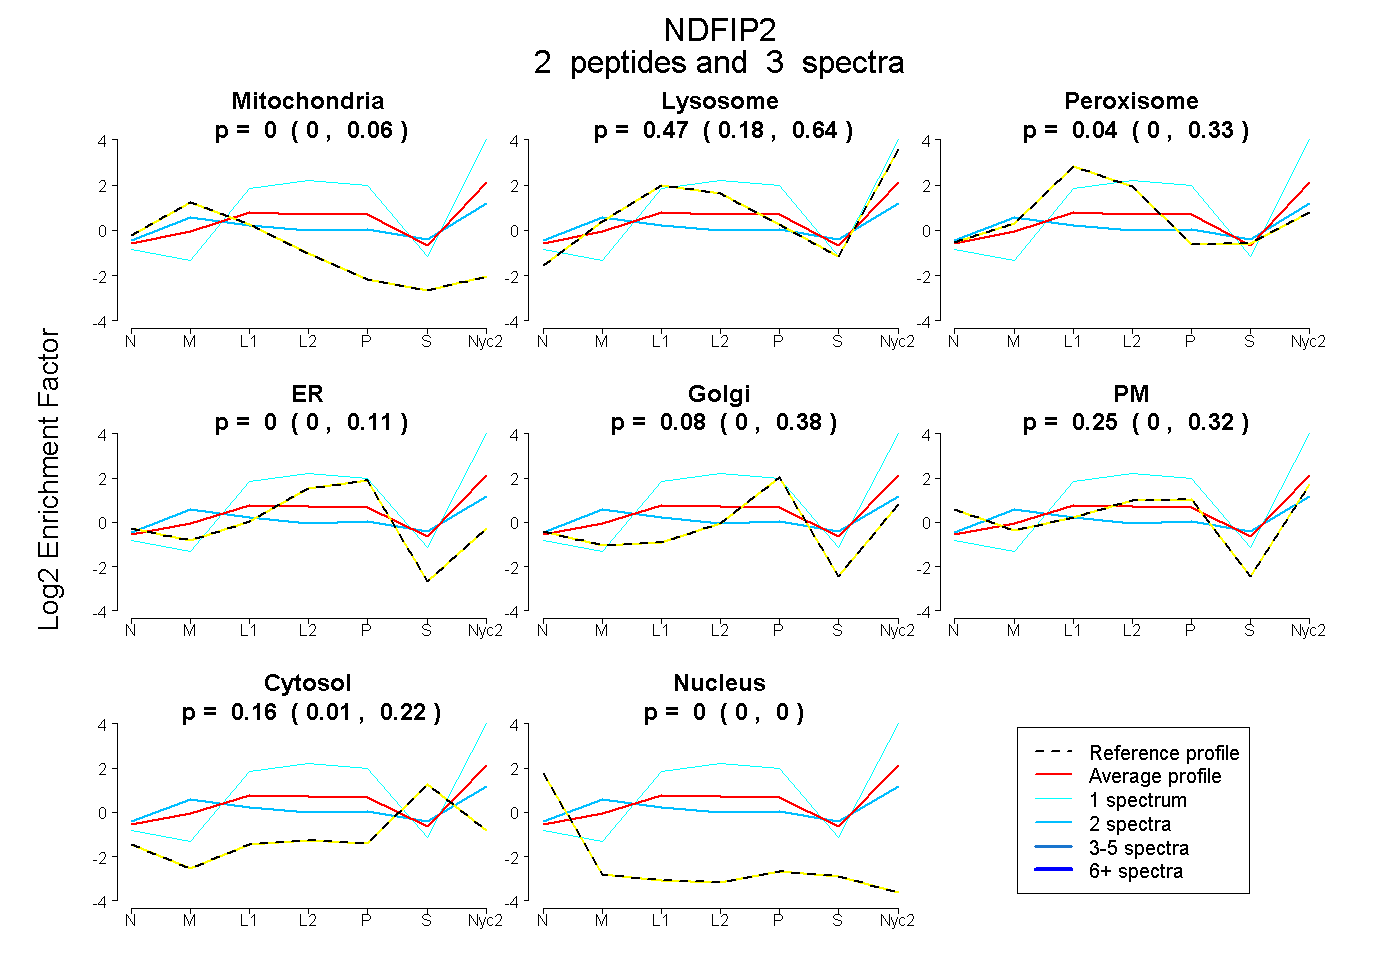
| Plot | Mito | Lyso | Perox | ER | Golgi | PM | Cytosol | Nucleus | |||||
| Expt A |
2 peptides |
3 spectra |
|
0.000 0.000 | 0.064 |
0.471 0.185 | 0.637 |
0.038 0.000 | 0.326 |
0.000 0.000 | 0.105 |
0.085 0.000 | 0.379 |
0.247 0.000 | 0.322 |
0.158 0.009 | 0.225 |
0.000 0.000 | 0.000 |
| 1 spectrum, DDFSDVEQLR | 0.000 | 0.807 | 0.000 | 0.031 | 0.093 | 0.069 | 0.000 | 0.000 | ||
| 2 spectra, GFVNYLK | 0.179 | 0.366 | 0.000 | 0.000 | 0.010 | 0.209 | 0.235 | 0.000 |
| Plot | Lyso | Other | |||||||||||
| Expt C |
2 peptides |
3 spectra |
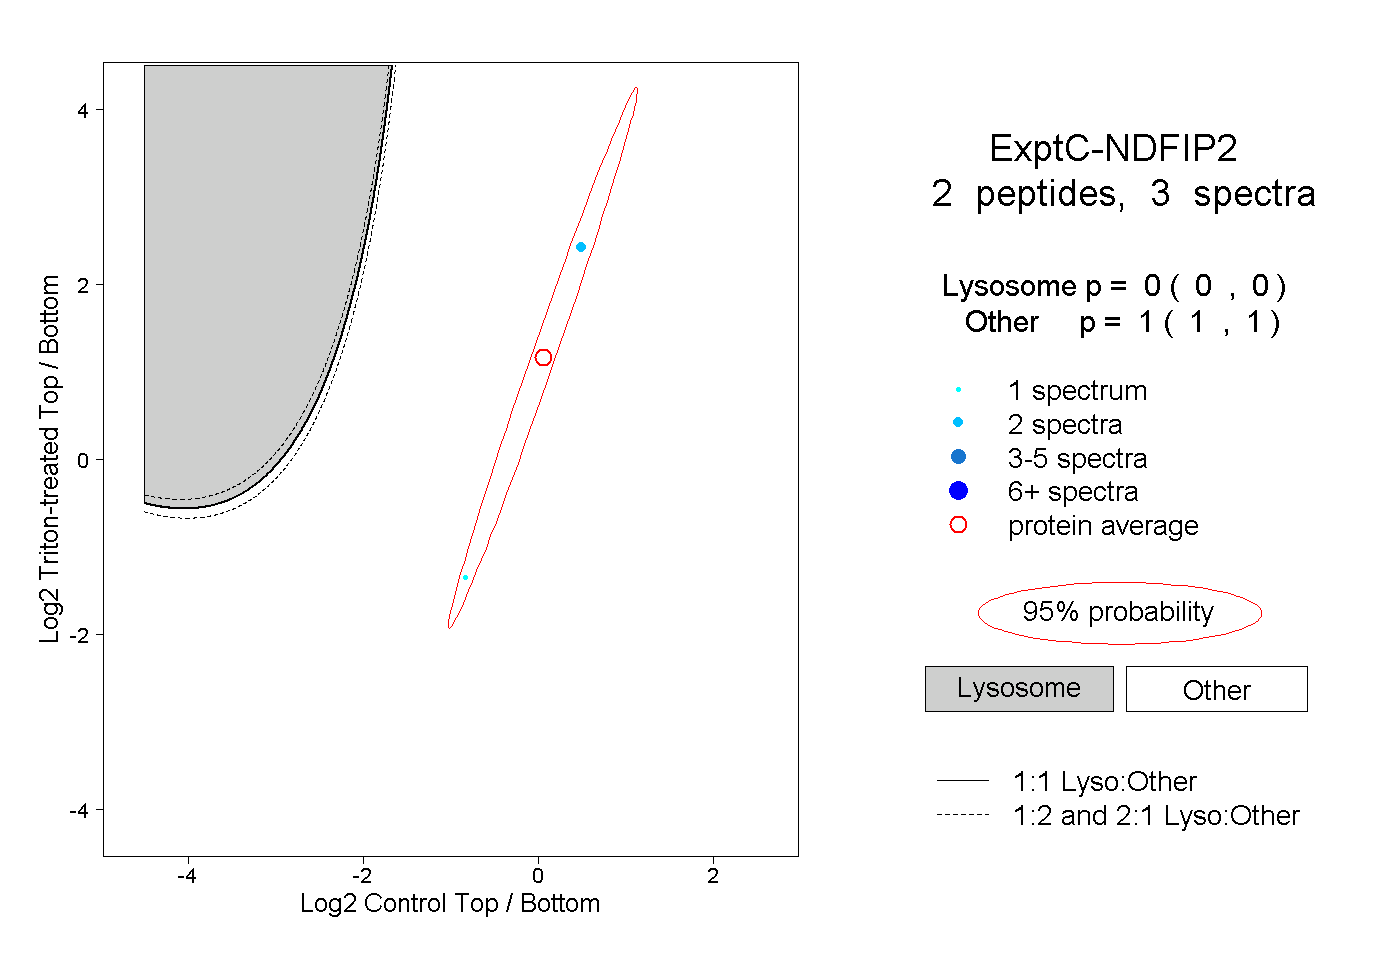 |
0.000 0.000 | 0.000 |
1.000 1.000 | 1.000 |