15
15peptides
spectra
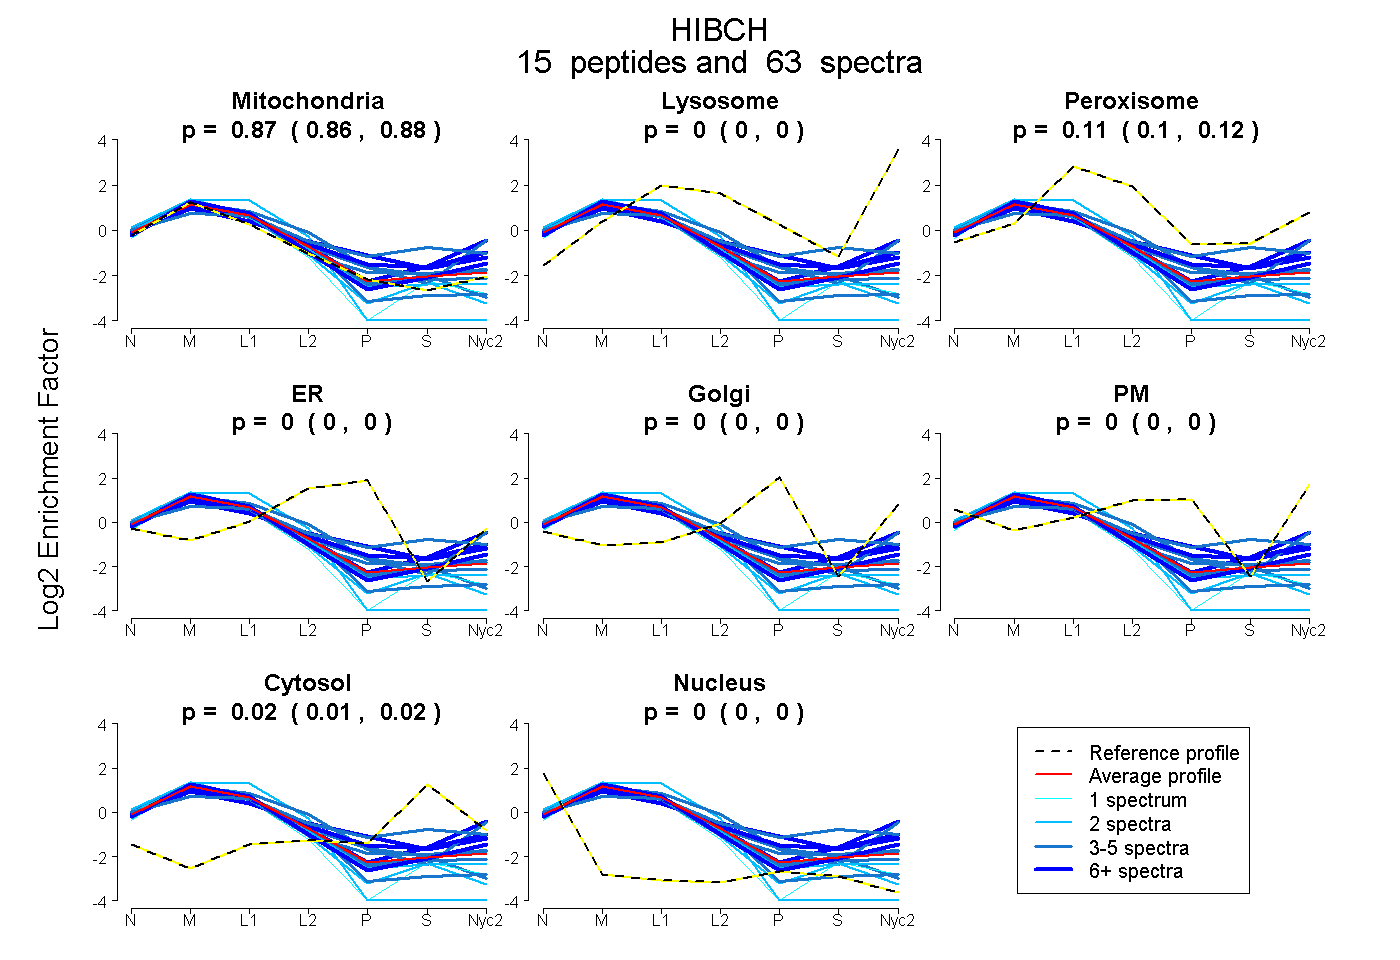
0.863 | 0.879
0.000 | 0.000
0.103 | 0.116
0.000 | 0.000
0.000 | 0.000
0.000 | 0.000
0.014 | 0.022
0.000 | 0.000
12peptides
spectra
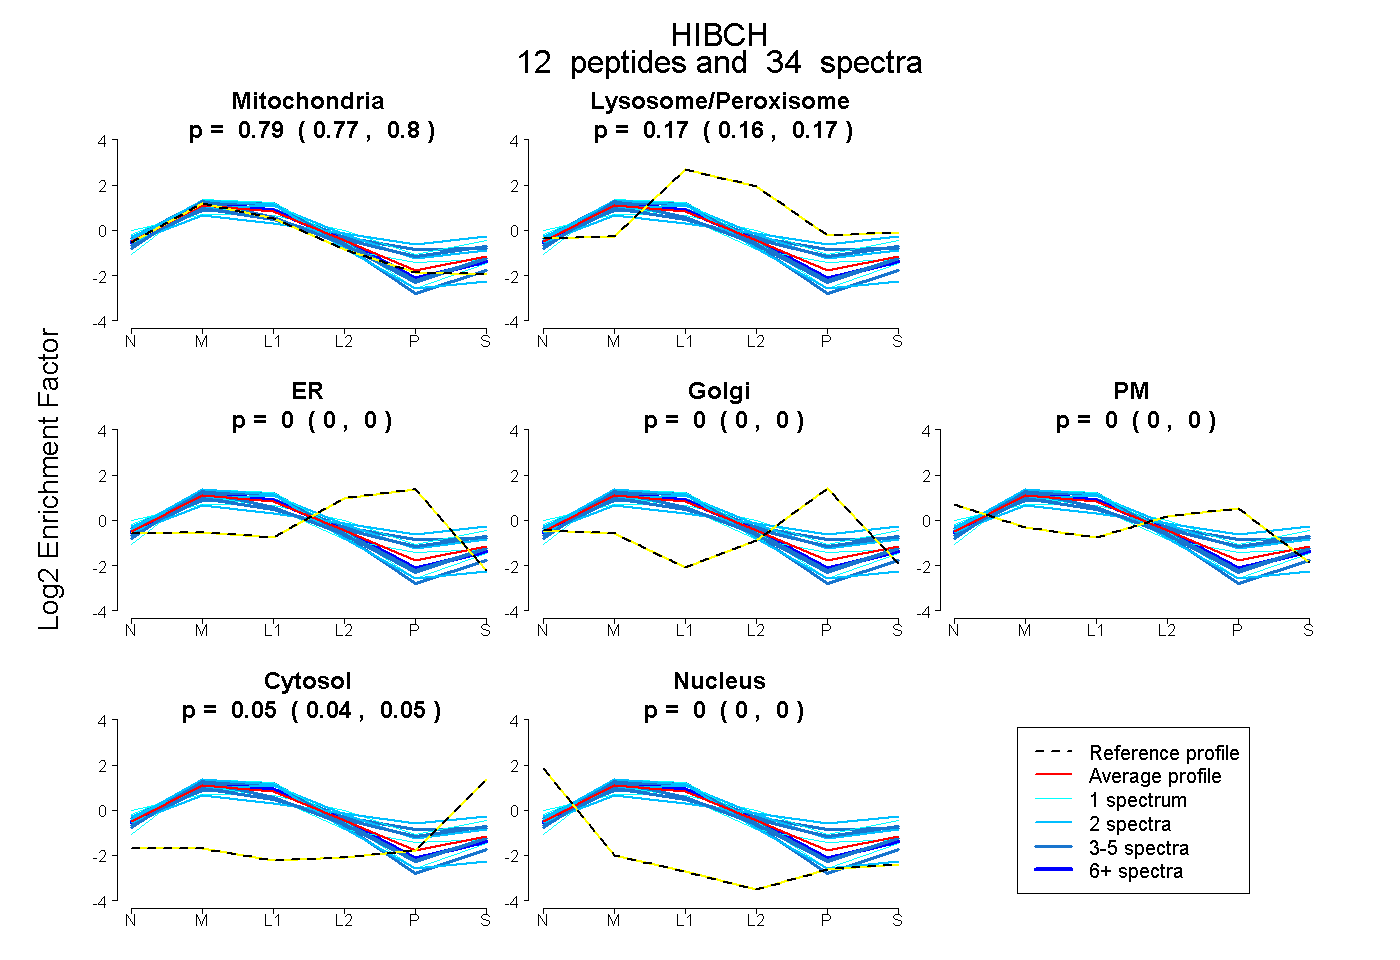
0.774 | 0.797
0.158 | 0.174
0.000 | 0.000
0.000 | 0.000
0.000 | 0.000
0.040 | 0.052
0.000 | 0.000