 15
15peptides
spectra
0.863 | 0.879
0.000 | 0.000
0.103 | 0.116
0.000 | 0.000
0.000 | 0.000
0.000 | 0.000
0.014 | 0.022
0.000 | 0.000
| Plot | Mito | Lyso | Perox | ER | Golgi | PM | Cytosol | Nucleus | |||||
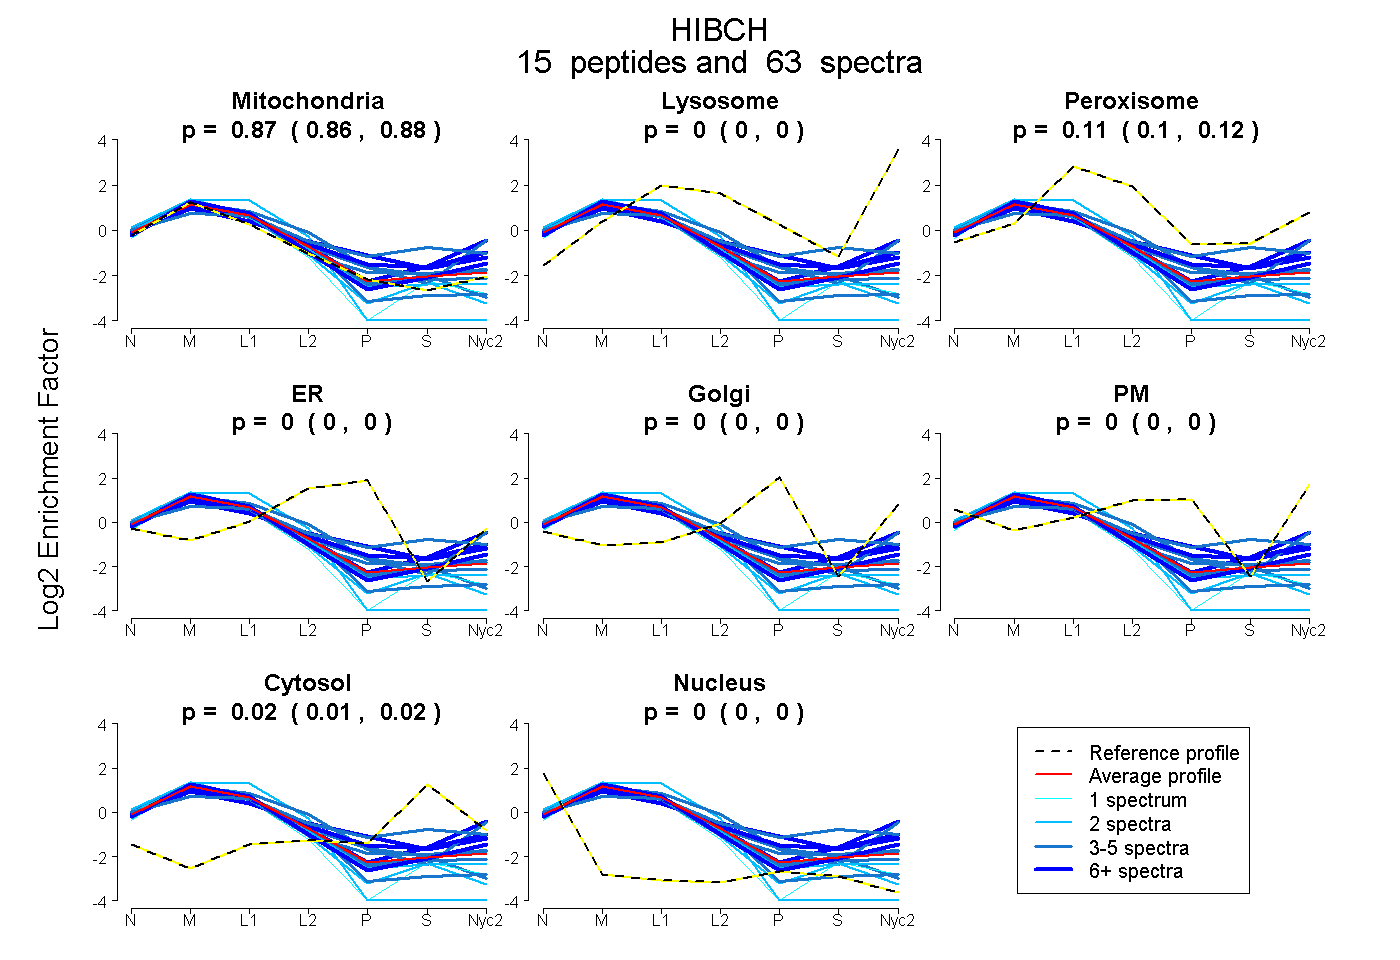
| Expt A |
15 peptides |
63 spectra |
|
0.872 0.863 | 0.879 |
0.000 0.000 | 0.000 |
0.110 0.103 | 0.116 |
0.000 0.000 | 0.000 |
0.000 0.000 | 0.000 |
0.000 0.000 | 0.000 |
0.018 0.014 | 0.022 |
0.000 0.000 | 0.000 |
| 2 spectra, HTETAEVLLER | 1.000 | 0.000 | 0.000 | 0.000 | 0.000 | 0.000 | 0.000 | 0.000 | ||
| 6 spectra, AFCAGGDIK | 0.710 | 0.156 | 0.071 | 0.000 | 0.000 | 0.000 | 0.062 | 0.000 | ||
| 7 spectra, LTQACMEGHDFHEGVR | 0.643 | 0.000 | 0.178 | 0.000 | 0.121 | 0.003 | 0.055 | 0.000 | ||
| 1 spectrum, DVTDEDLNSYFK | 0.984 | 0.000 | 0.000 | 0.000 | 0.000 | 0.000 | 0.000 | 0.016 | ||
| 4 spectra, LHVLEEELLALK | 0.994 | 0.000 | 0.000 | 0.000 | 0.000 | 0.000 | 0.000 | 0.006 | ||
| 7 spectra, SIIFEEHMDK | 0.694 | 0.066 | 0.149 | 0.000 | 0.000 | 0.024 | 0.067 | 0.000 | ||
| 3 spectra, MSPTSLK | 0.843 | 0.000 | 0.099 | 0.000 | 0.000 | 0.000 | 0.058 | 0.000 | ||
| 2 spectra, GCAGVITLNRPK | 0.988 | 0.000 | 0.000 | 0.000 | 0.000 | 0.000 | 0.000 | 0.012 | ||
| 8 spectra, TLQEVLTMEYR | 0.882 | 0.000 | 0.105 | 0.000 | 0.000 | 0.000 | 0.012 | 0.000 | ||
| 3 spectra, QDGSPFAMEQIK | 0.687 | 0.168 | 0.089 | 0.000 | 0.000 | 0.057 | 0.000 | 0.000 | ||
| 3 spectra, AGIATHFVDSEK | 0.780 | 0.000 | 0.157 | 0.014 | 0.000 | 0.000 | 0.018 | 0.032 | ||
| 5 spectra, DPDTFLIIIK | 0.983 | 0.000 | 0.000 | 0.000 | 0.000 | 0.000 | 0.007 | 0.010 | ||
| 5 spectra, AGQTLSQDLFR | 0.914 | 0.000 | 0.072 | 0.000 | 0.000 | 0.000 | 0.000 | 0.014 | ||
| 2 spectra, QIYPQLK | 0.985 | 0.000 | 0.015 | 0.000 | 0.000 | 0.000 | 0.000 | 0.000 | ||
| 5 spectra, SPSAEDVAGVLESYHAK | 0.506 | 0.000 | 0.280 | 0.000 | 0.000 | 0.025 | 0.189 | 0.000 |
| Plot | Mito | Lyso or Perox | ER | Golgi | PM | Cytosol | Nucleus | ||||||
| Expt B |
12 peptides |
34 spectra |
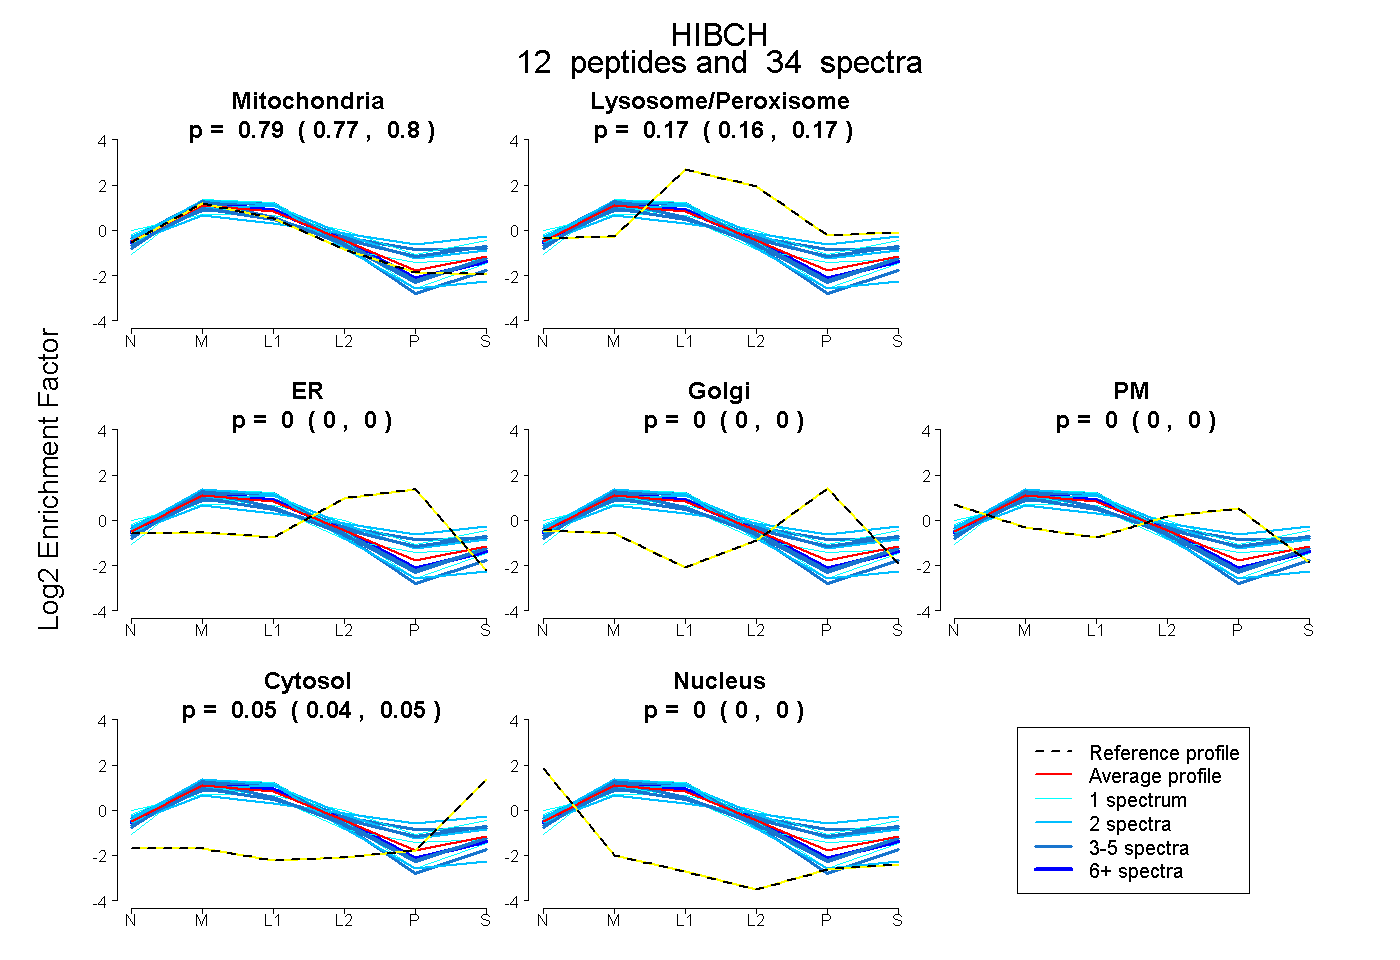 |
0.786 0.774 | 0.797 |
0.167 0.158 | 0.174 |
0.000 0.000 | 0.000 |
0.000 0.000 | 0.000 |
0.000 0.000 | 0.000 |
0.047 0.040 | 0.052 |
0.000 0.000 | 0.000 |
|||
| Plot | Lyso | Other | |||||||||||
| Expt C |
22 peptides |
260 spectra |
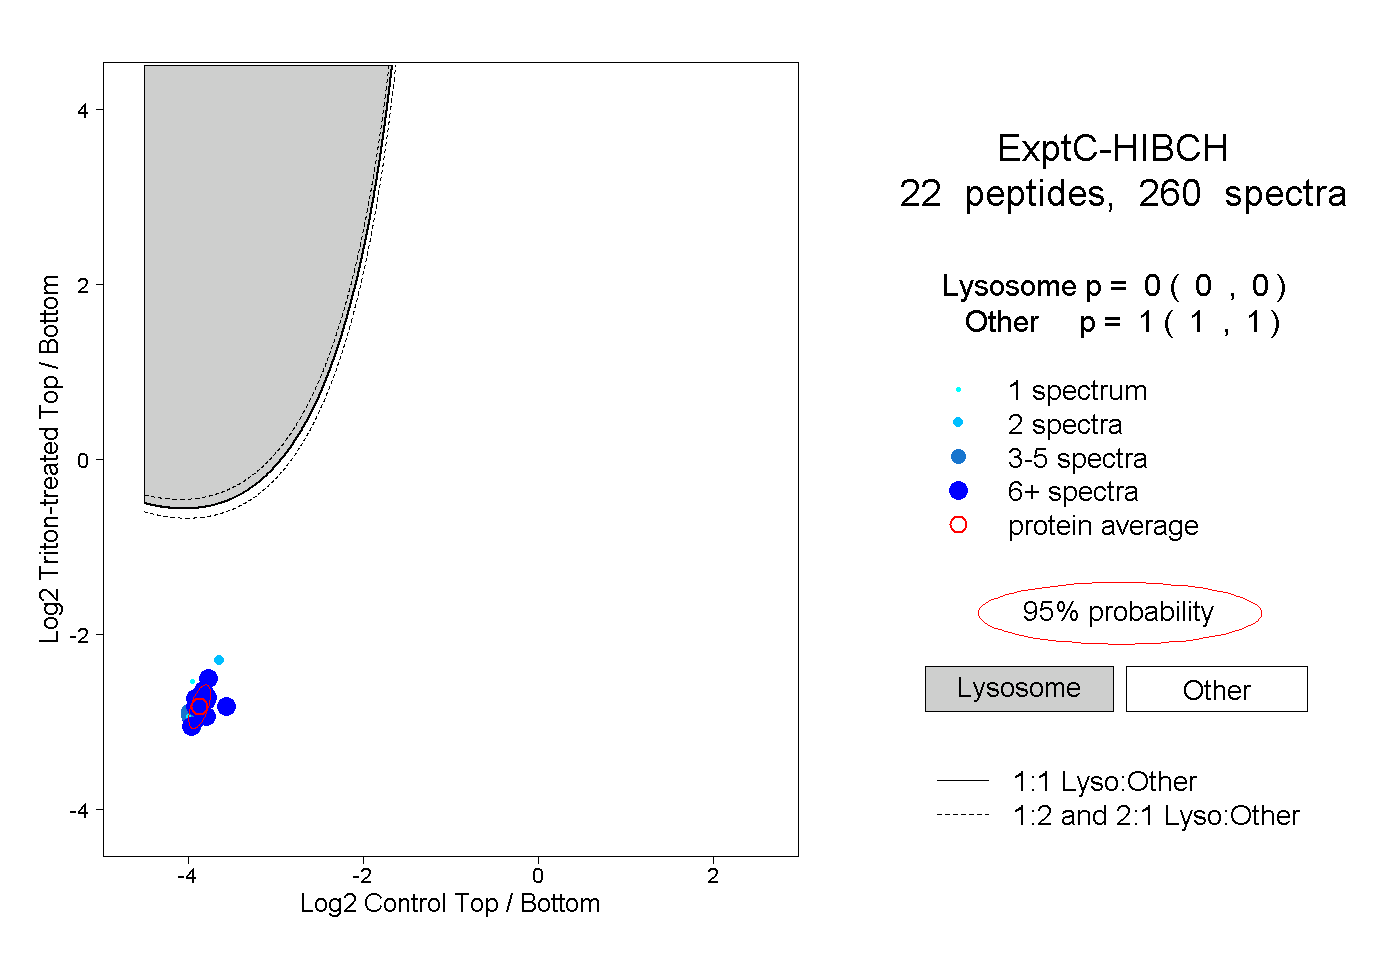 |
0.000 0.000 | 0.000 |
1.000 1.000 | 1.000 |
||||||||
| Plot | Lyso | Other | |||||||||||
| Expt D |
9 peptides |
27 spectra |
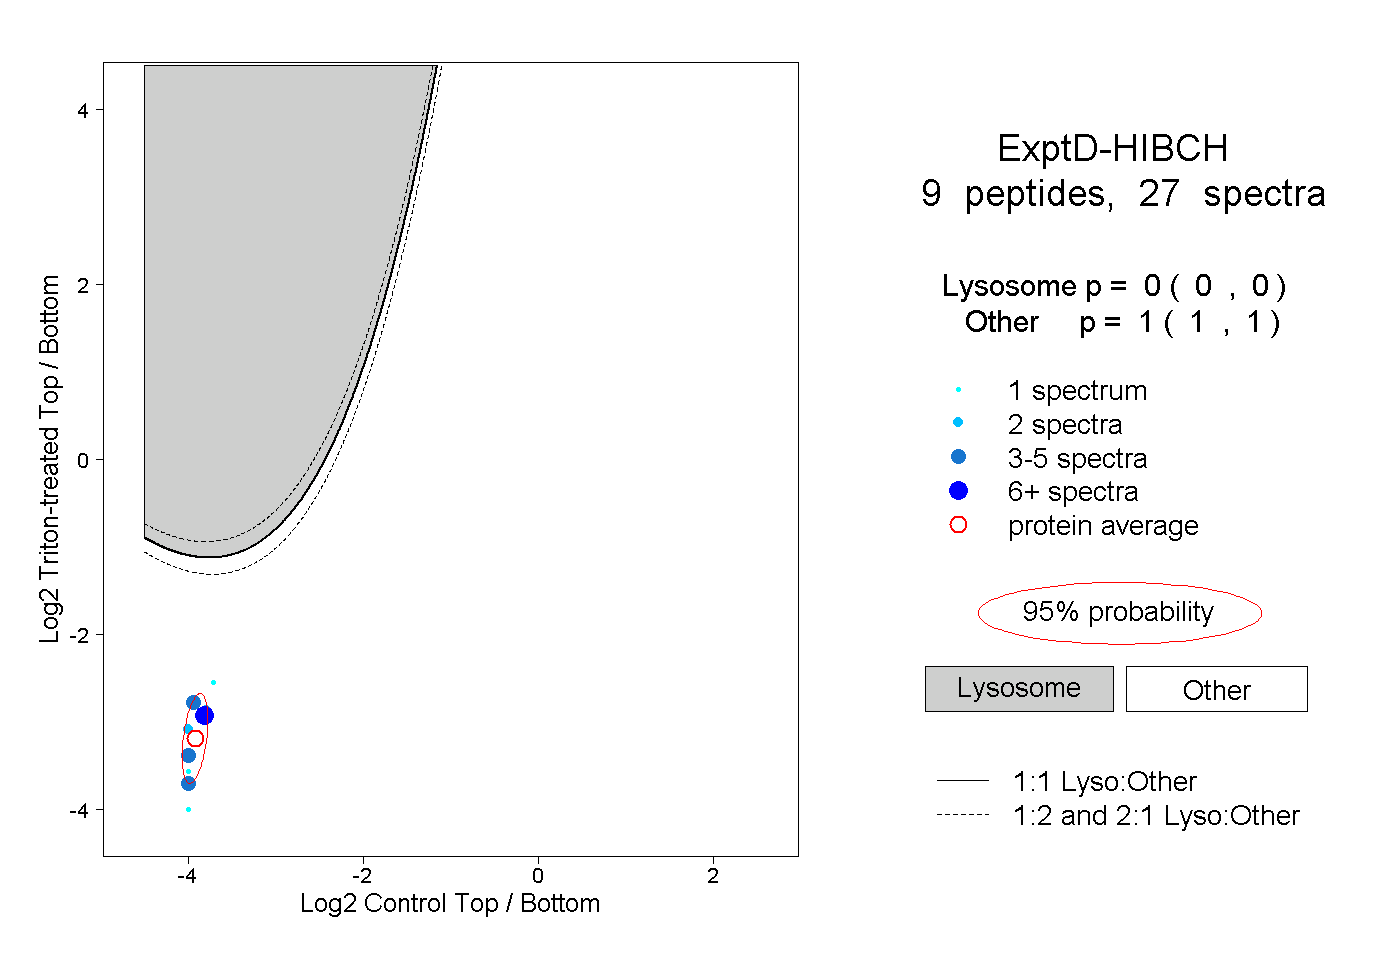 |
0.000 0.000 | 0.000 |
1.000 1.000 | 1.000 |