 2
2peptides
spectra
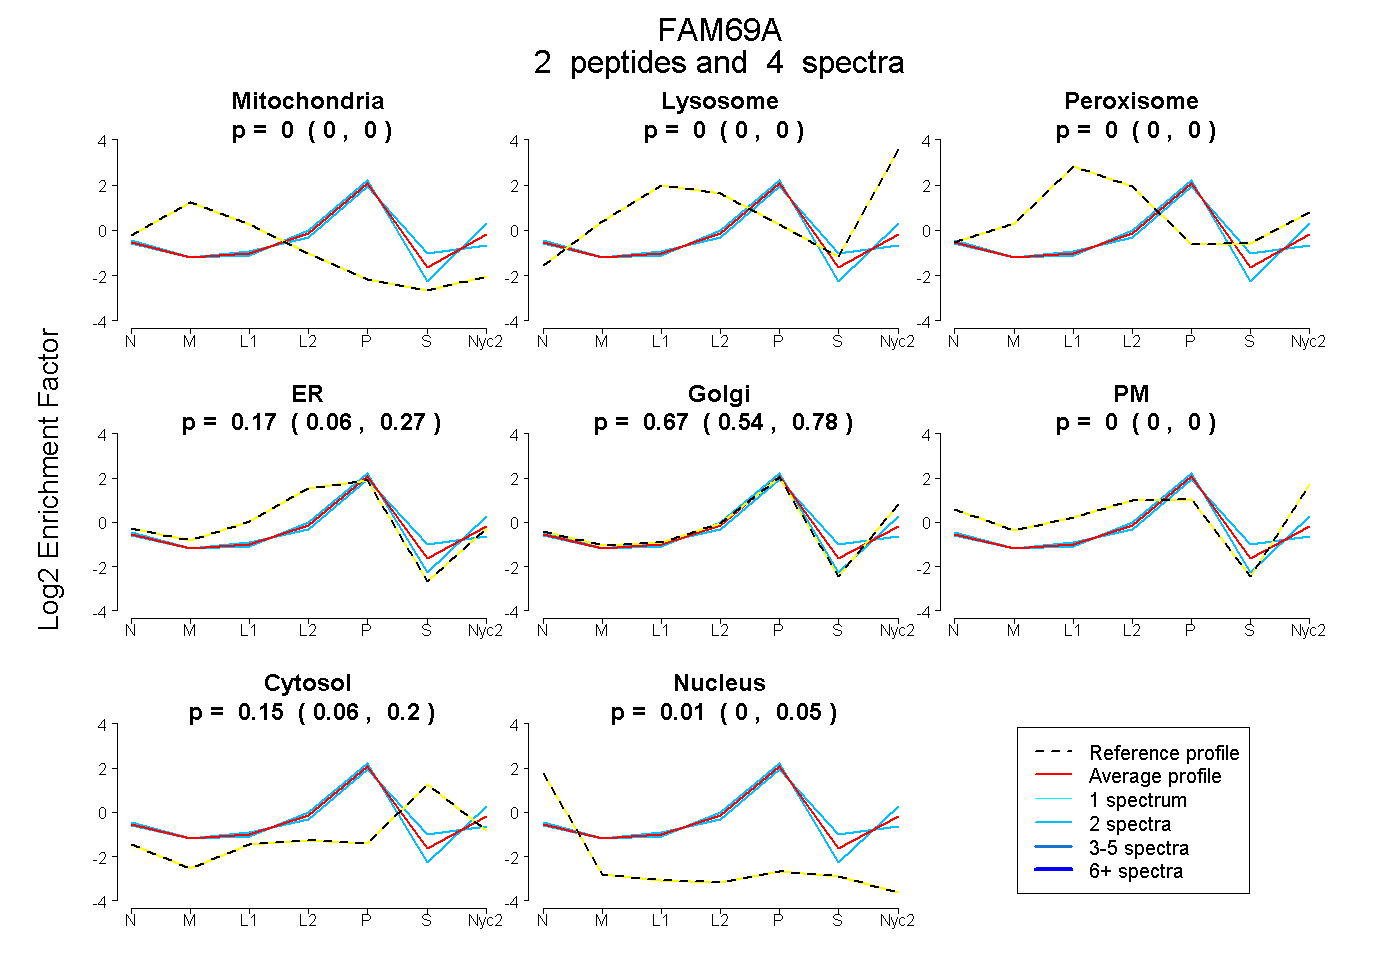
0.000 | 0.000
0.000 | 0.000
0.000 | 0.000
0.062 | 0.266
0.539 | 0.775
0.000 | 0.000
0.062 | 0.199
0.000 | 0.049
| Plot | Mito | Lyso | Perox | ER | Golgi | PM | Cytosol | Nucleus | |||||
| Expt A |
2 peptides |
4 spectra |
|
0.000 0.000 | 0.000 |
0.000 0.000 | 0.000 |
0.000 0.000 | 0.000 |
0.168 0.062 | 0.266 |
0.675 0.539 | 0.775 |
0.000 0.000 | 0.000 |
0.146 0.062 | 0.199 |
0.012 0.000 | 0.049 |
| 2 spectra, HCESDLDCVYGTDCR | 0.000 | 0.000 | 0.000 | 0.250 | 0.478 | 0.000 | 0.262 | 0.010 | ||
| 2 spectra, CQMEQAPHLDFGTDLEPR | 0.000 | 0.000 | 0.000 | 0.085 | 0.871 | 0.000 | 0.030 | 0.013 |
| Plot | Lyso | Other | |||||||||||
| Expt C |
3 peptides |
5 spectra |
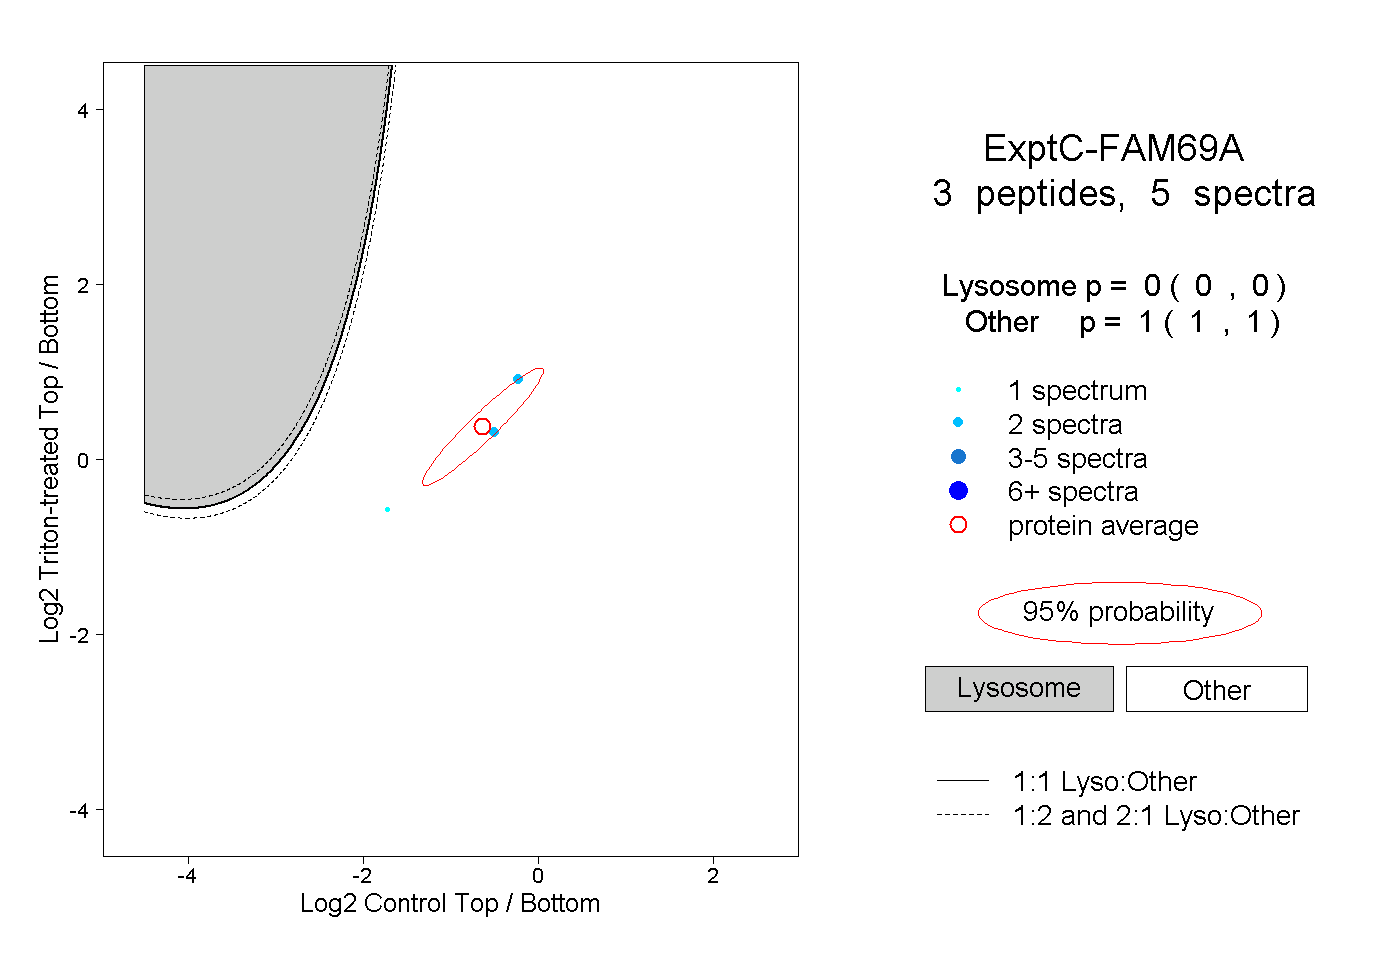 |
0.000 0.000 | 0.000 |
1.000 1.000 | 1.000 |