 2
2peptides
spectra
0.000 | 0.041
0.000 | 0.244
0.000 | 0.000
0.000 | 0.000
0.041 | 0.505
0.258 | 0.778
0.000 | 0.000
0.000 | 0.062
2peptides
spectra
0.000 | 0.000
1.000 | 1.000
| Plot | Mito | Lyso | Perox | ER | Golgi | PM | Cytosol | Nucleus | |||||
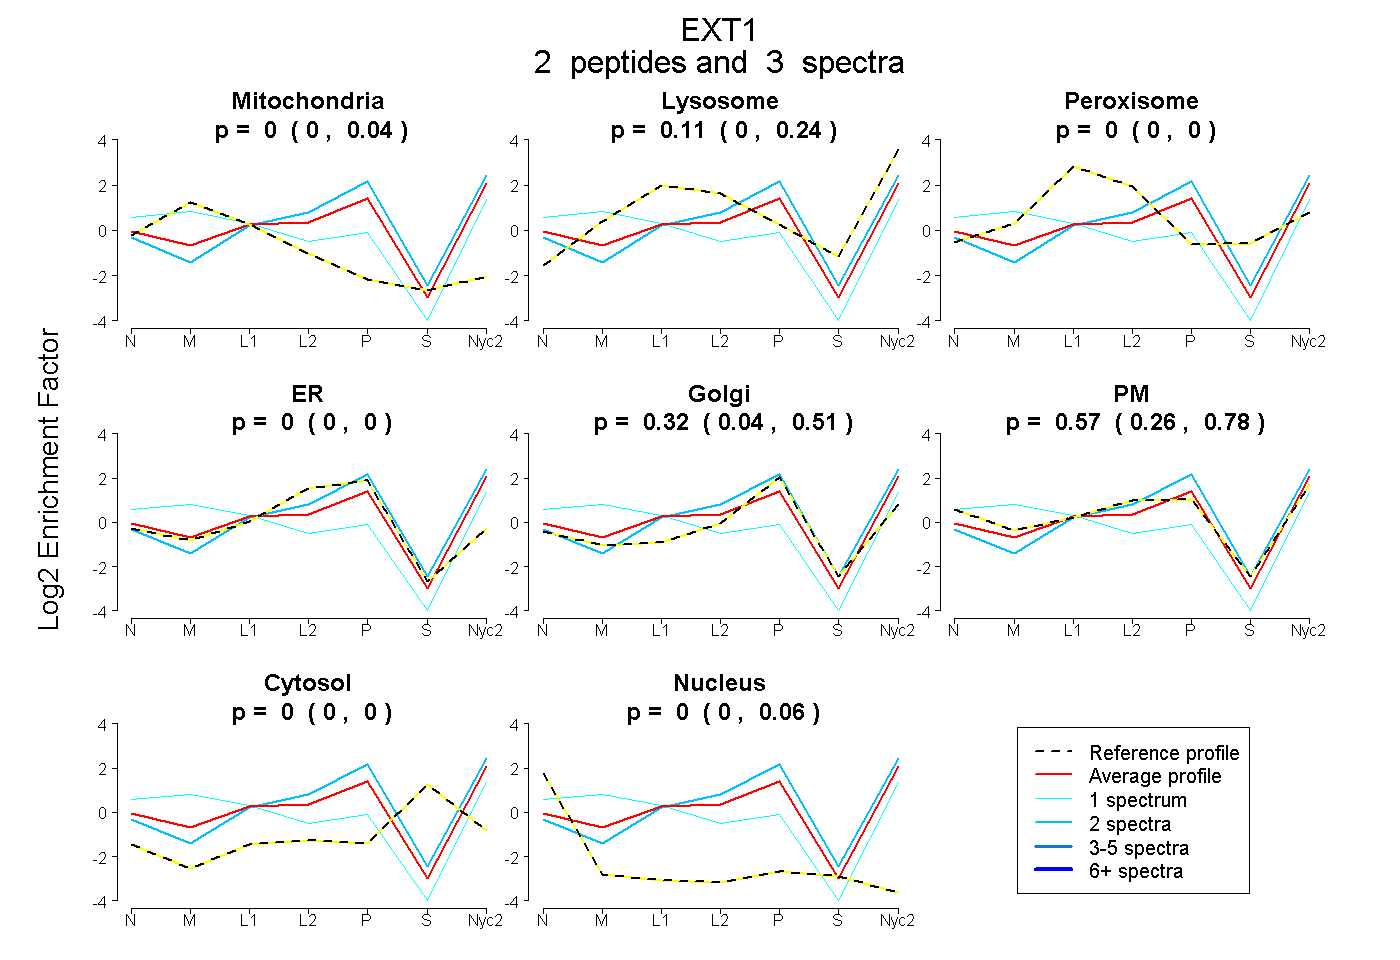
| Expt A |
2 peptides |
3 spectra |
|
0.000 0.000 | 0.041 |
0.108 0.000 | 0.244 |
0.000 0.000 | 0.000 |
0.000 0.000 | 0.000 |
0.323 0.041 | 0.505 |
0.568 0.258 | 0.778 |
0.000 0.000 | 0.000 |
0.000 0.000 | 0.062 |
||
| Plot | Lyso | Other | |||||||||||
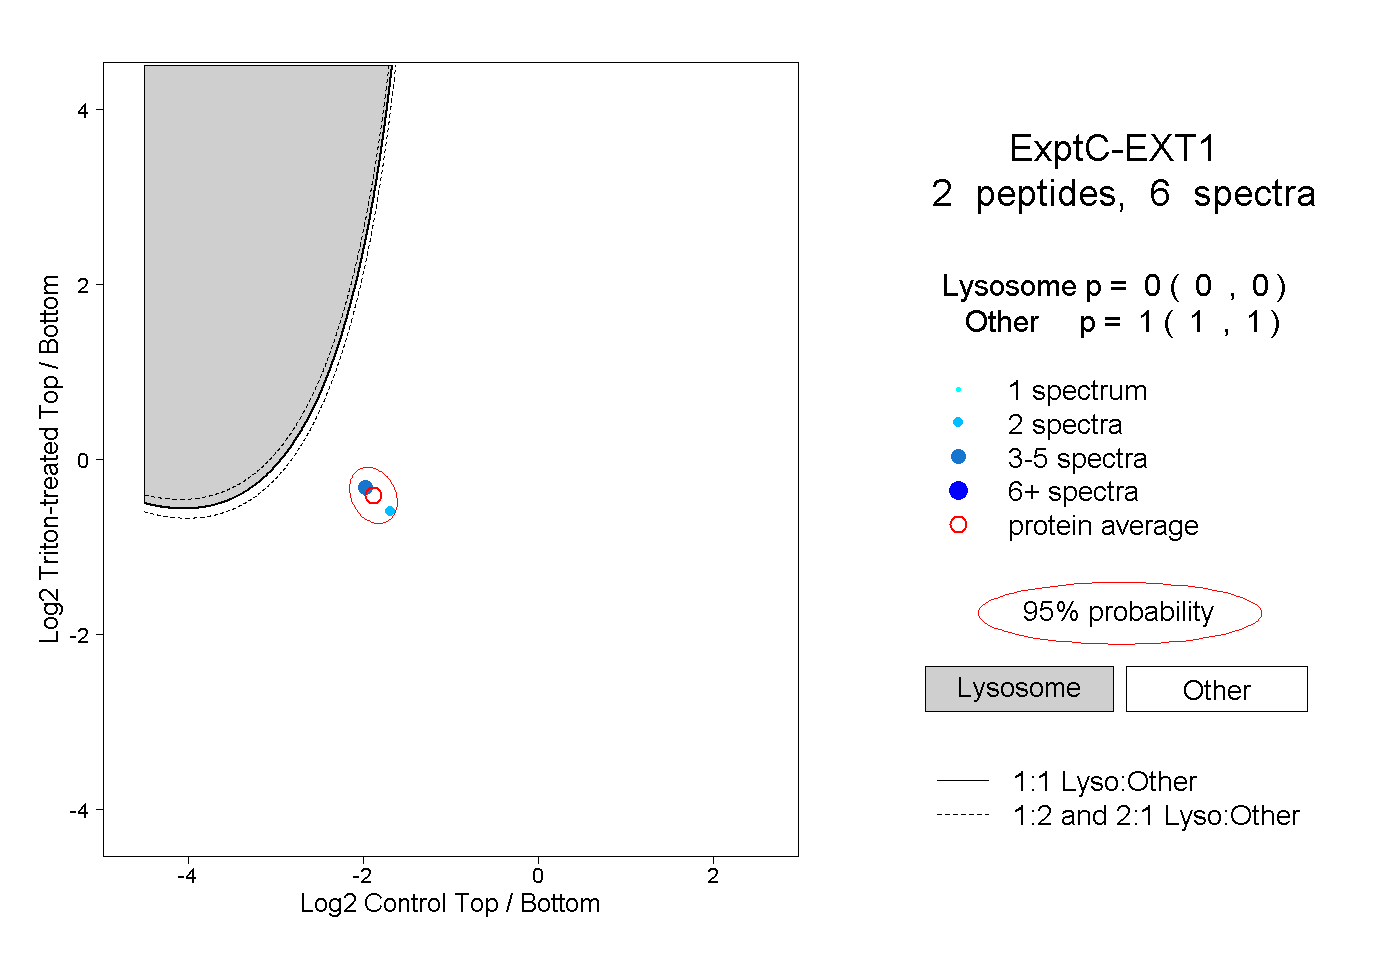
| Expt C |
2 peptides |
6 spectra |
|
0.000 0.000 | 0.000 |
1.000 1.000 | 1.000 |