 9
9peptides
spectra
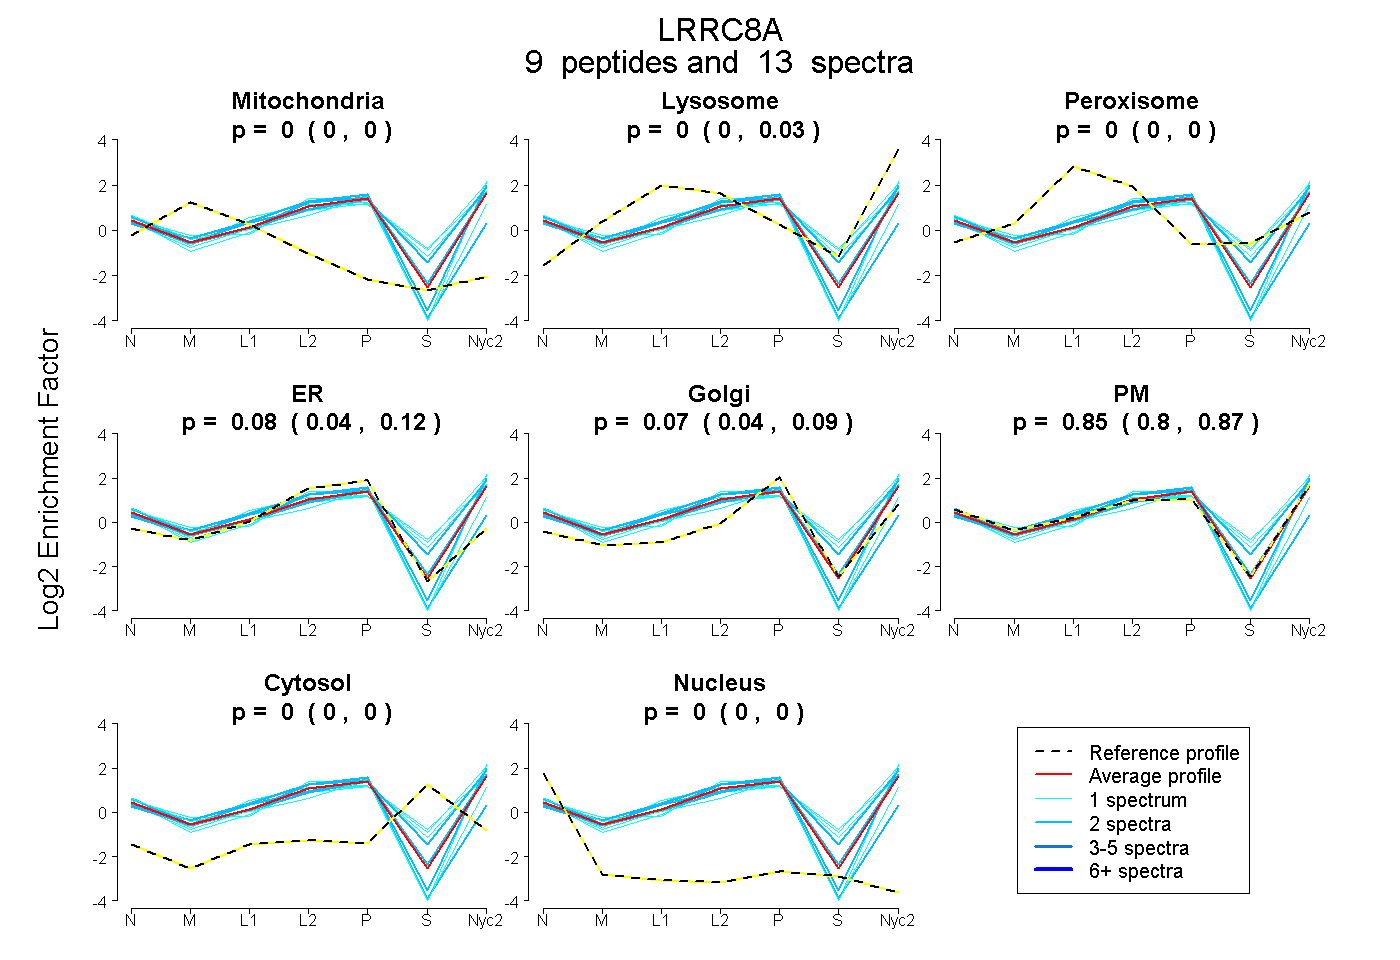
0.000 | 0.000
0.000 | 0.026
0.000 | 0.000
0.043 | 0.117
0.044 | 0.095
0.796 | 0.869
0.000 | 0.000
0.000 | 0.000
9peptides
spectra
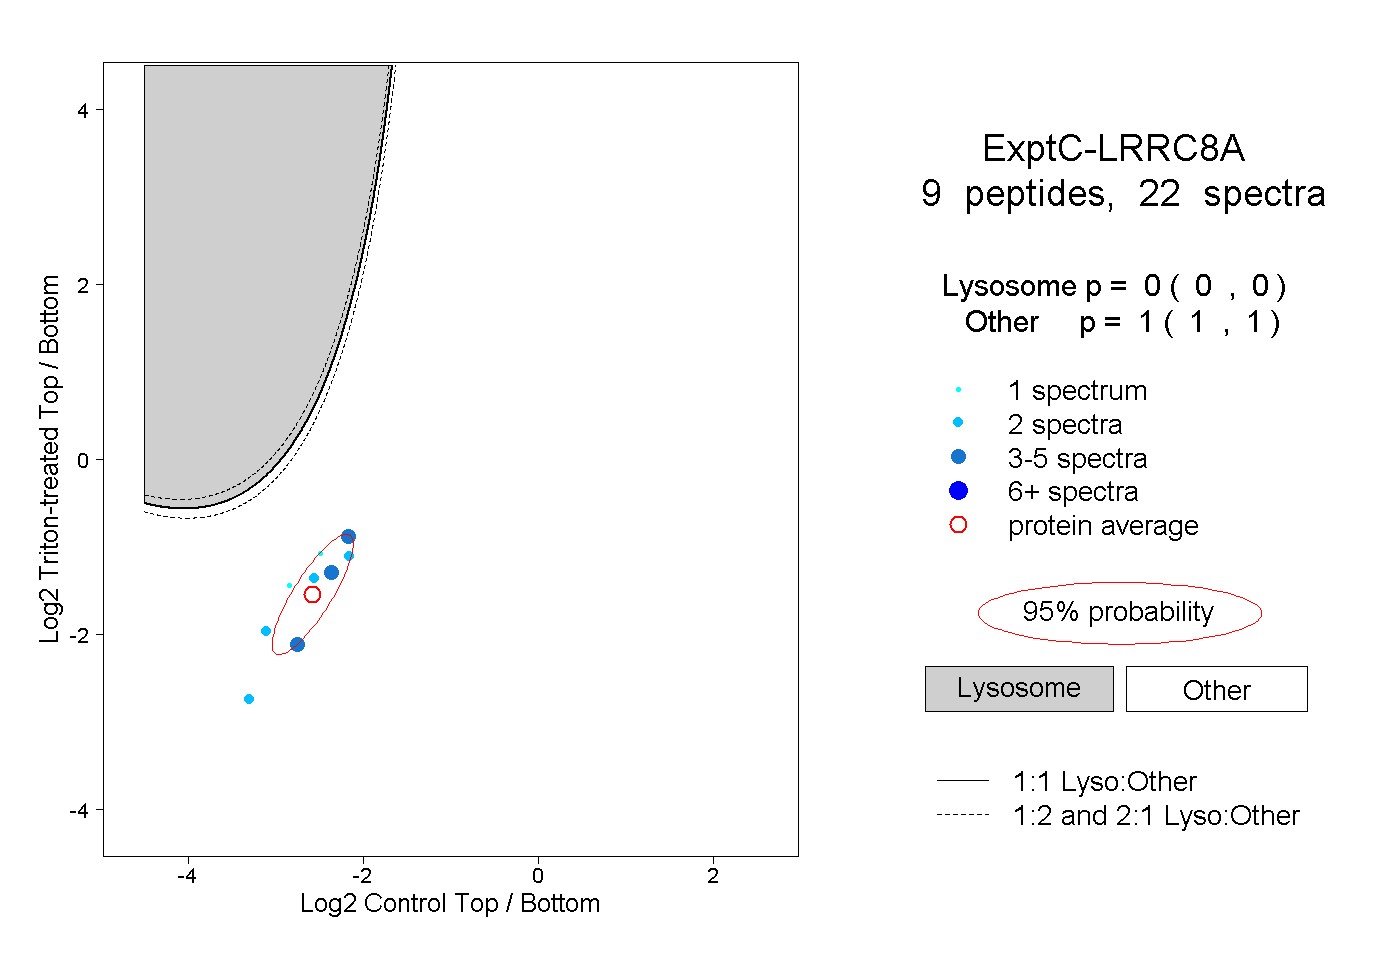
0.000 | 0.000
1.000 | 1.000
| Plot | Mito | Lyso | Perox | ER | Golgi | PM | Cytosol | Nucleus | |||||
| Expt A |
9 peptides |
13 spectra |
|
0.000 0.000 | 0.000 |
0.003 0.000 | 0.026 |
0.000 0.000 | 0.000 |
0.082 0.043 | 0.117 |
0.069 0.044 | 0.095 |
0.847 0.796 | 0.869 |
0.000 0.000 | 0.000 |
0.000 0.000 | 0.000 |
||
| Plot | Lyso | Other | |||||||||||
| Expt C |
9 peptides |
22 spectra |
|
0.000 0.000 | 0.000 |
1.000 1.000 | 1.000 |
| 2 spectra, THVEEGDIVYR | 0.000 | 1.000 | ||||||||
| 1 spectrum, LSINNEGTK | 0.000 | 1.000 | ||||||||
| 4 spectra, EGEQAK | 0.000 | 1.000 | ||||||||
| 1 spectrum, SETGVLDK | 0.000 | 1.000 | ||||||||
| 4 spectra, IEQGIVDR | 0.000 | 1.000 | ||||||||
| 2 spectra, ELWLYHTAAK | 0.000 | 1.000 | ||||||||
| 2 spectra, IEAPALAFLR | 0.000 | 1.000 | ||||||||
| 2 spectra, ALHLGNNVLQSLPSR | 0.000 | 1.000 | ||||||||
| 4 spectra, IPTQLFYCR | 0.000 | 1.000 |