 3
3peptides
spectra
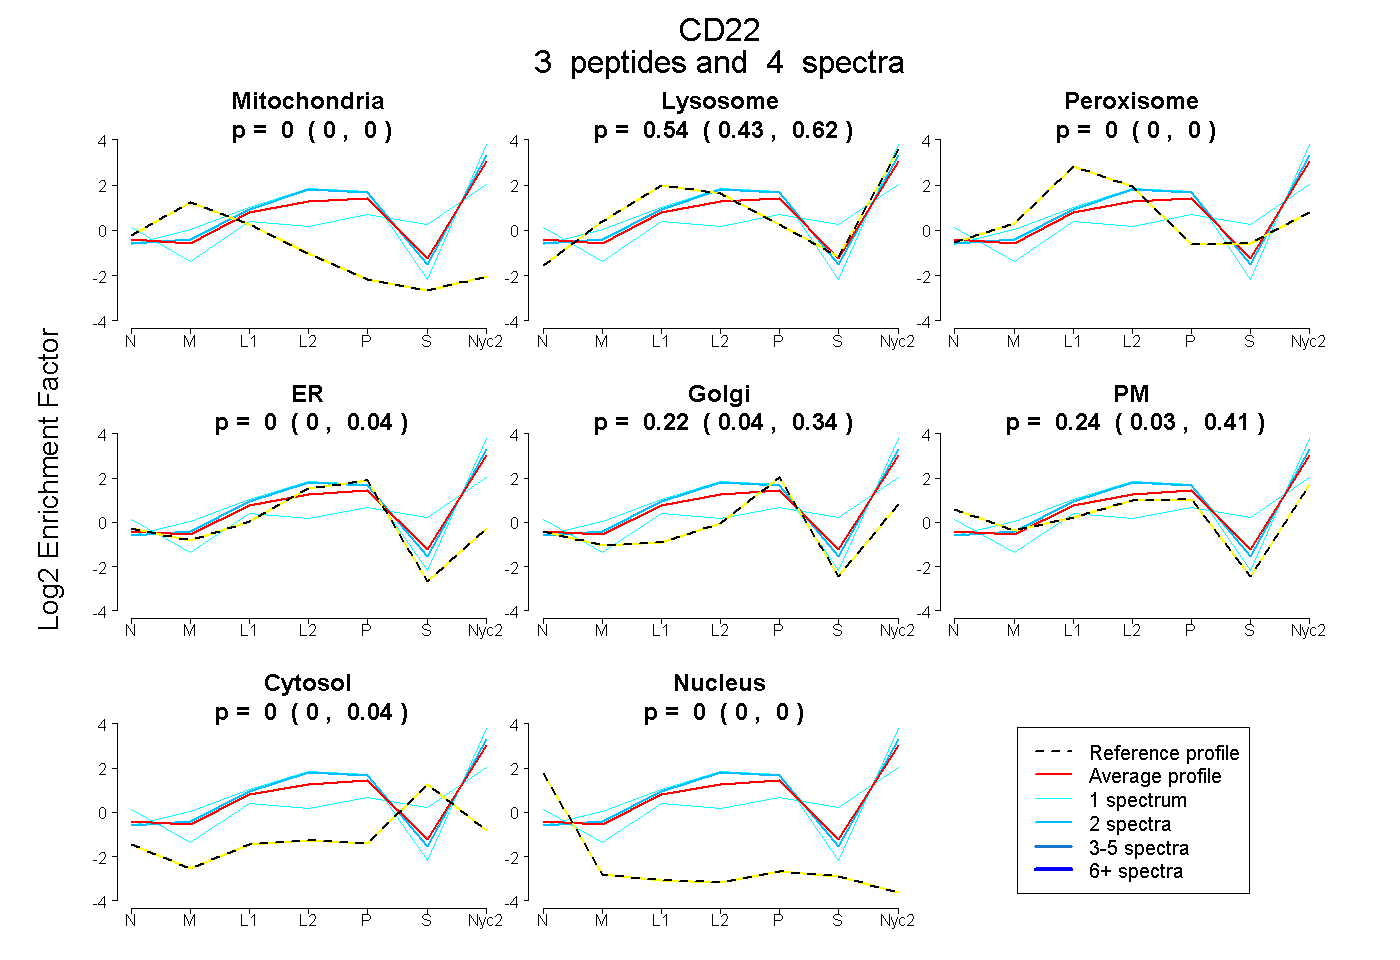
0.000 | 0.000
0.429 | 0.624
0.000 | 0.000
0.000 | 0.040
0.044 | 0.342
0.032 | 0.412
0.000 | 0.043
0.000 | 0.000
| Plot | Mito | Lyso | Perox | ER | Golgi | PM | Cytosol | Nucleus | |||||
| Expt A |
3 peptides |
4 spectra |
|
0.000 0.000 | 0.000 |
0.537 0.429 | 0.624 |
0.000 0.000 | 0.000 |
0.000 0.000 | 0.040 |
0.223 0.044 | 0.342 |
0.241 0.032 | 0.412 |
0.000 0.000 | 0.043 |
0.000 0.000 | 0.000 |
| 1 spectrum, SPPSTLTVYYSPETIGK | 0.000 | 0.301 | 0.000 | 0.000 | 0.000 | 0.358 | 0.342 | 0.000 | ||
| 1 spectrum, AVTTVIQSVTPIR | 0.000 | 0.599 | 0.000 | 0.000 | 0.000 | 0.401 | 0.000 | 0.000 | ||
| 2 spectra, VTFLGNR | 0.000 | 0.587 | 0.000 | 0.000 | 0.136 | 0.277 | 0.000 | 0.000 |
| Plot | Lyso | Other | |||||||||||
| Expt C |
5 peptides |
9 spectra |
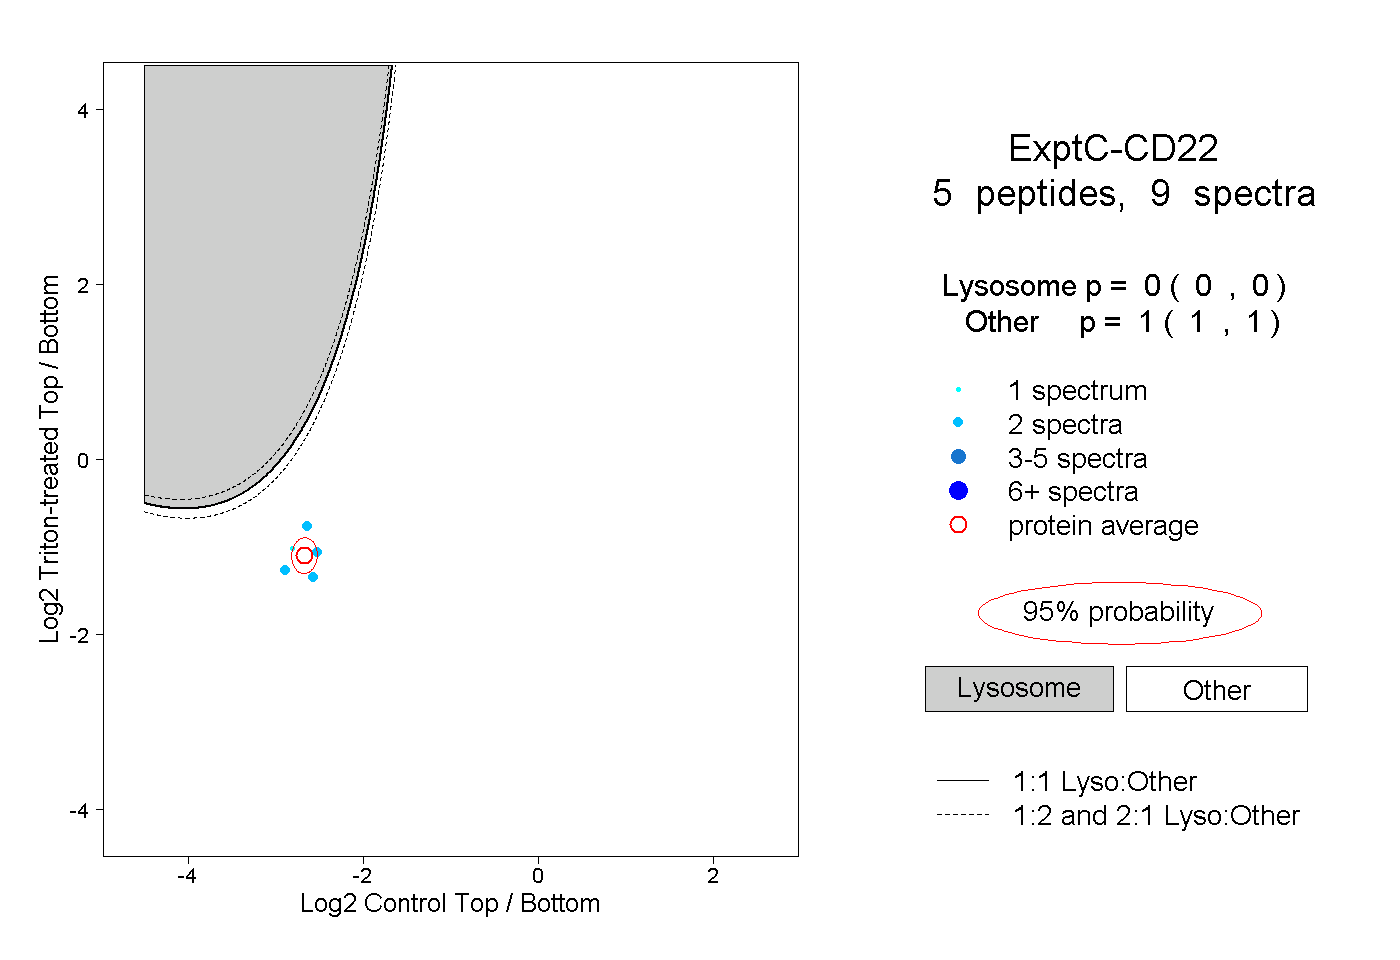 |
0.000 0.000 | 0.000 |
1.000 1.000 | 1.000 |