 2
2peptides
spectra
0.000 | 0.000
0.000 | 0.000
0.000 | 0.000
0.012 | 0.112
0.733 | 0.828
0.000 | 0.000
0.034 | 0.106
0.057 | 0.095
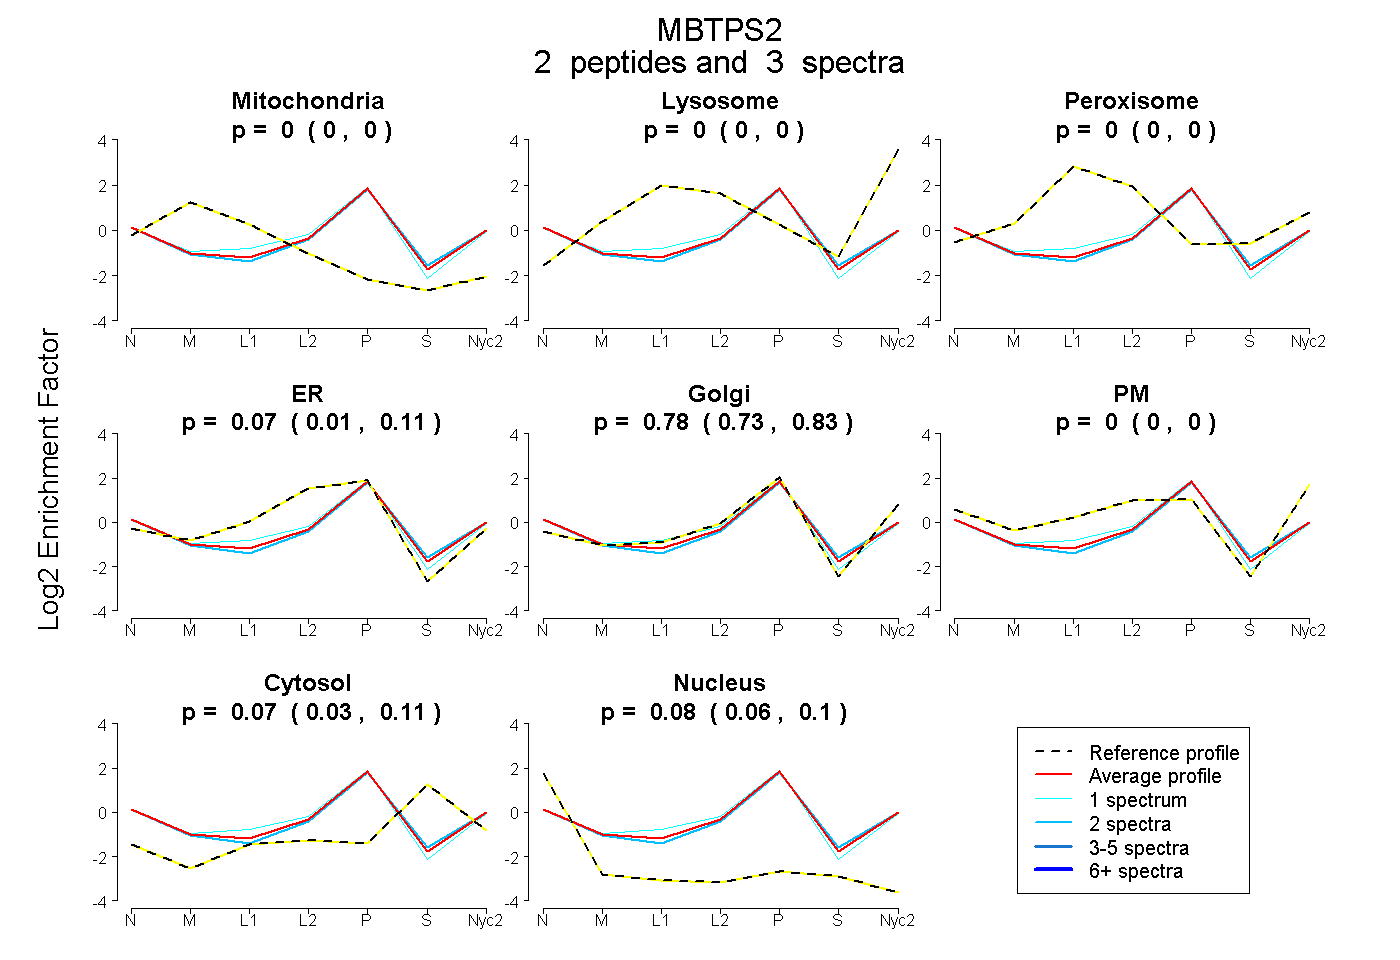
| Plot | Mito | Lyso | Perox | ER | Golgi | PM | Cytosol | Nucleus | |||||
| Expt A |
2 peptides |
3 spectra |
|
0.000 0.000 | 0.000 |
0.000 0.000 | 0.000 |
0.000 0.000 | 0.000 |
0.066 0.012 | 0.112 |
0.783 0.733 | 0.828 |
0.000 0.000 | 0.000 |
0.073 0.034 | 0.106 |
0.078 0.057 | 0.095 |