 8
8peptides
spectra
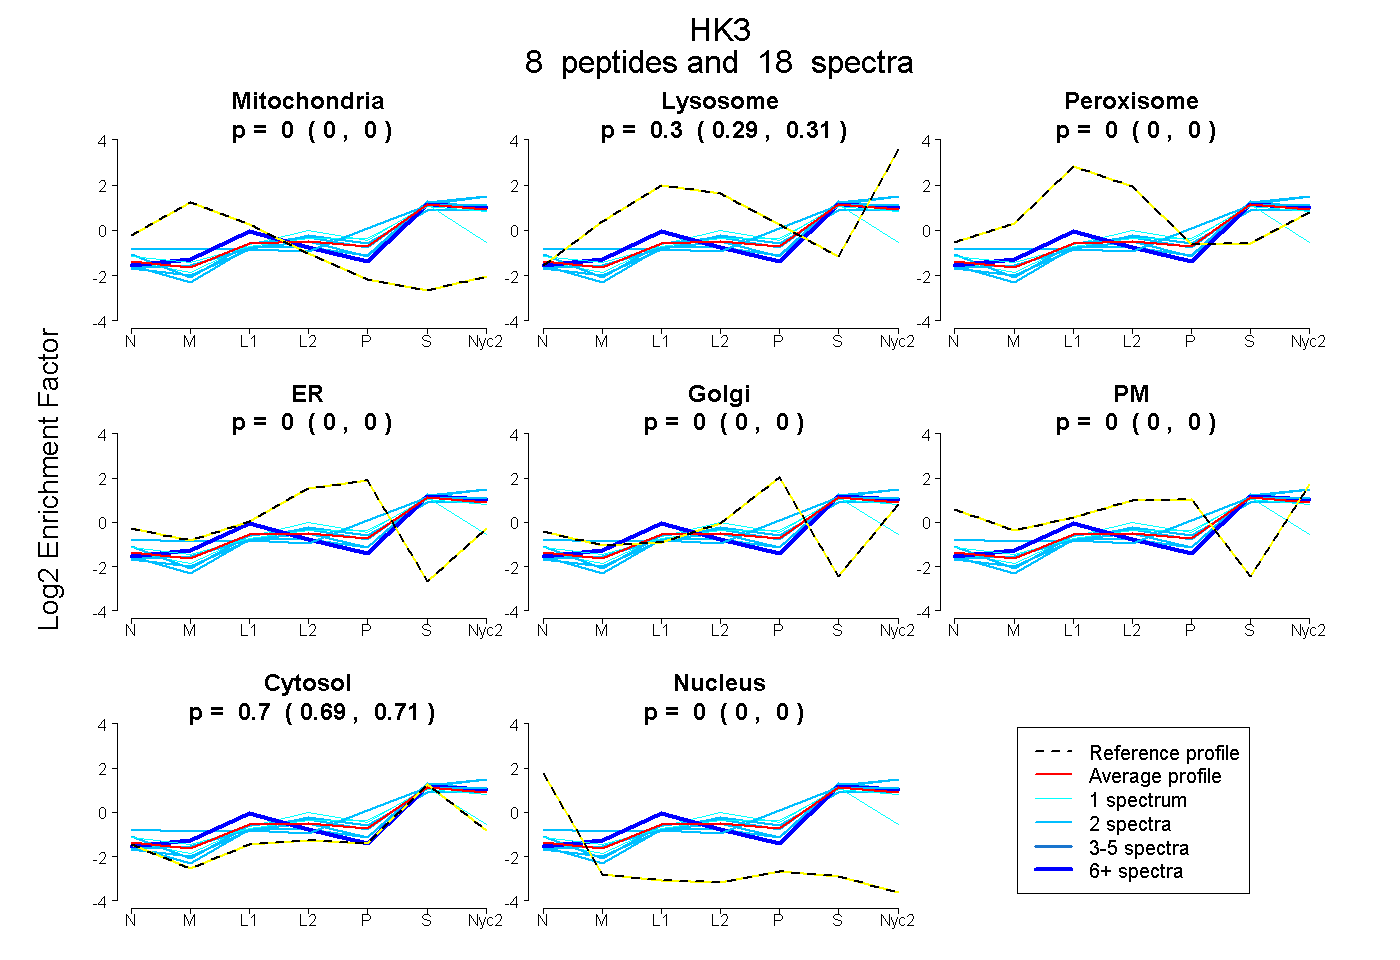
0.000 | 0.000
0.288 | 0.308
0.000 | 0.000
0.000 | 0.000
0.000 | 0.000
0.000 | 0.000
0.690 | 0.710
0.000 | 0.000
1peptide
spectrum
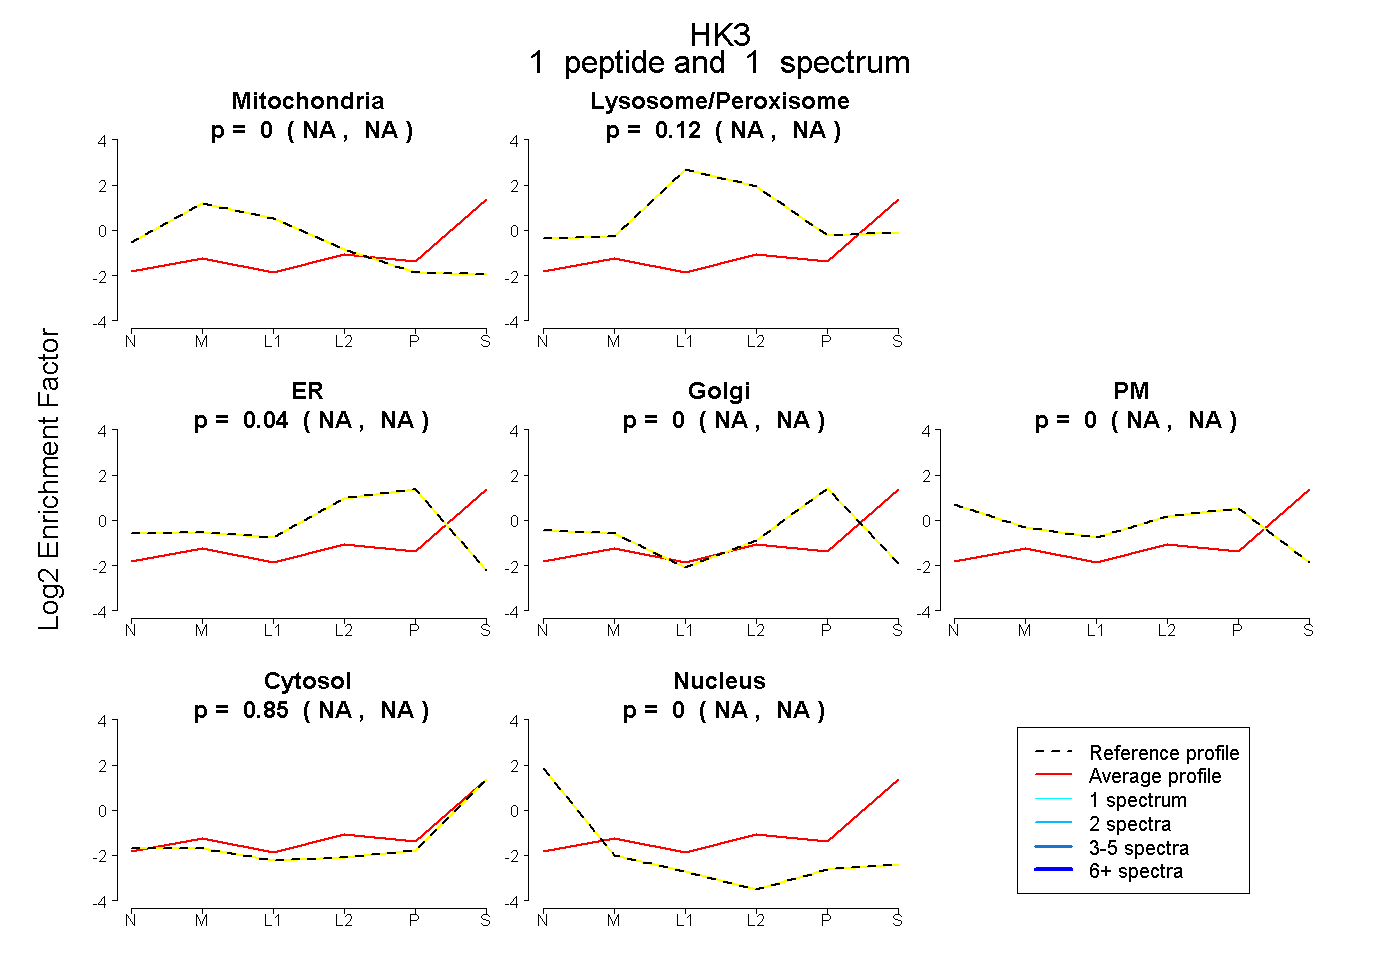
NA | NA
NA | NA
NA | NA
NA | NA
NA | NA
NA | NA
NA | NA
5peptides
spectra
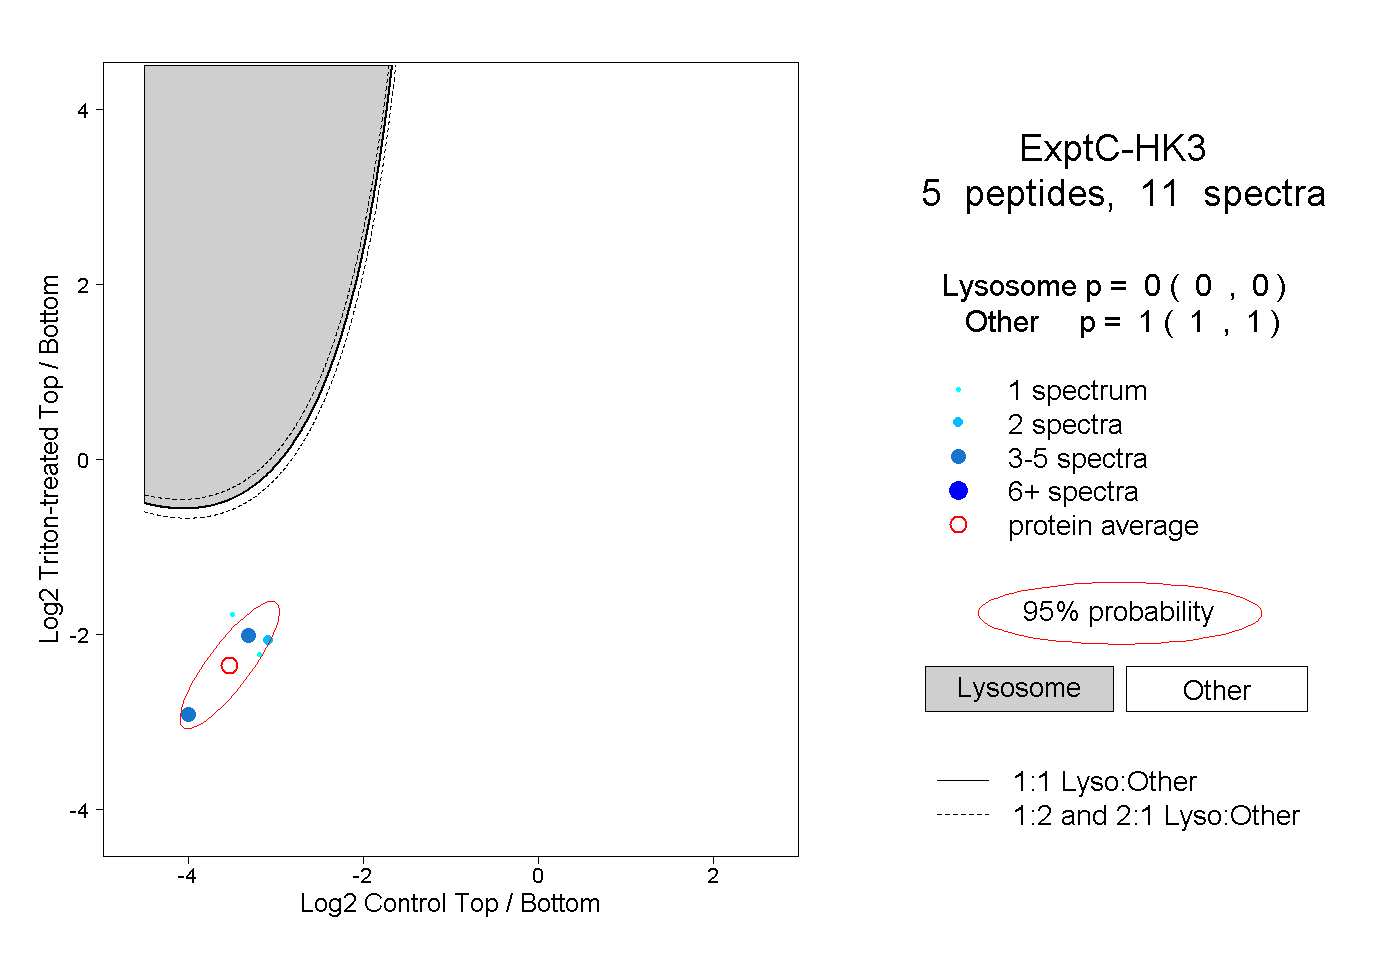
0.000 | 0.000
1.000 | 1.000
1peptide
spectrum
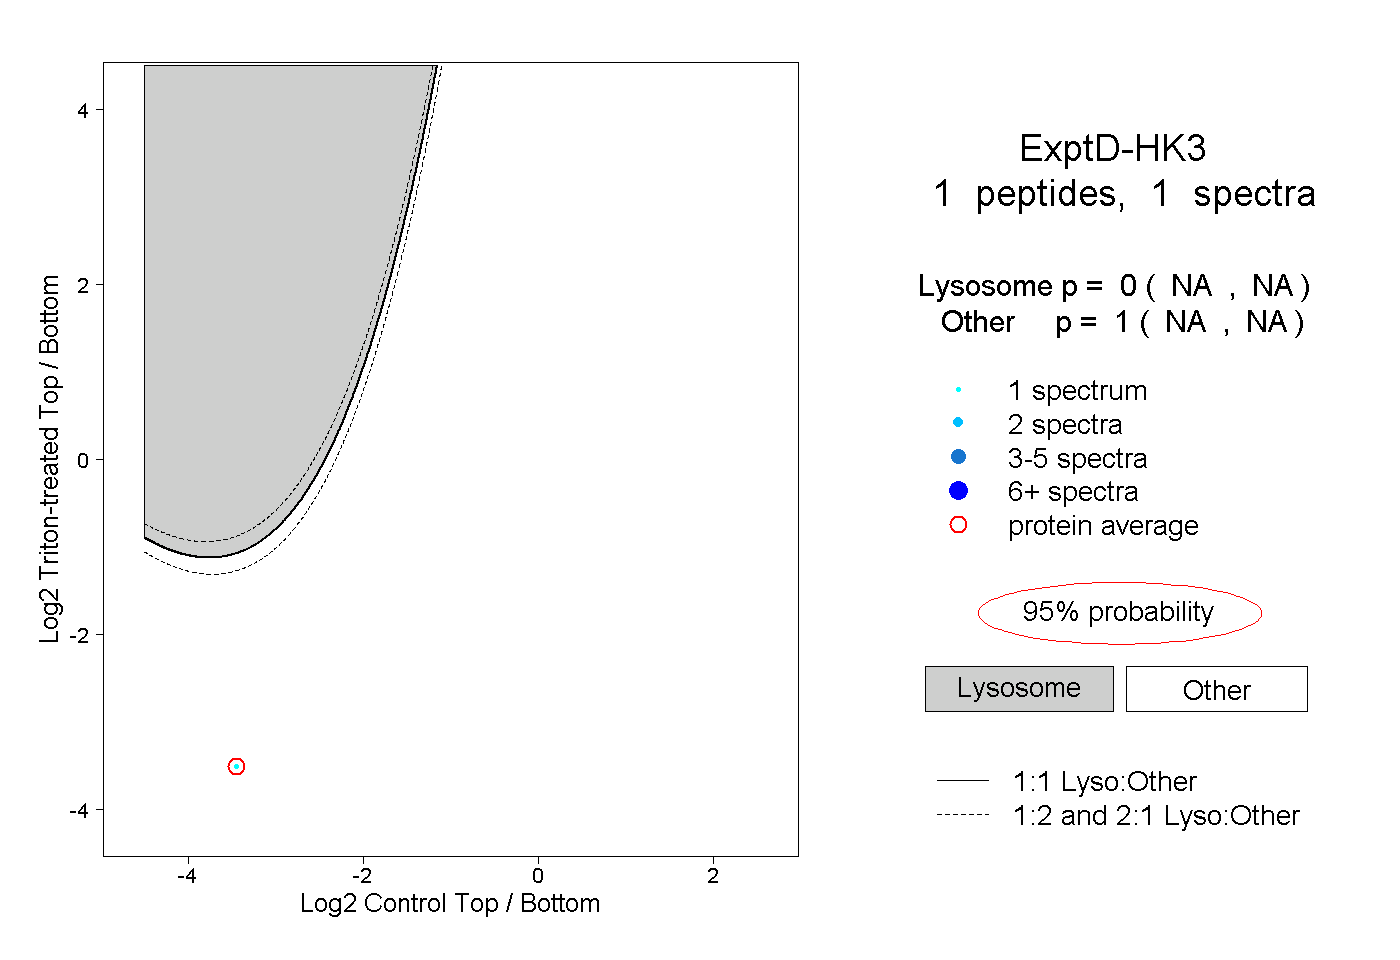
NA | NA
NA | NA