 1
1peptide
spectra
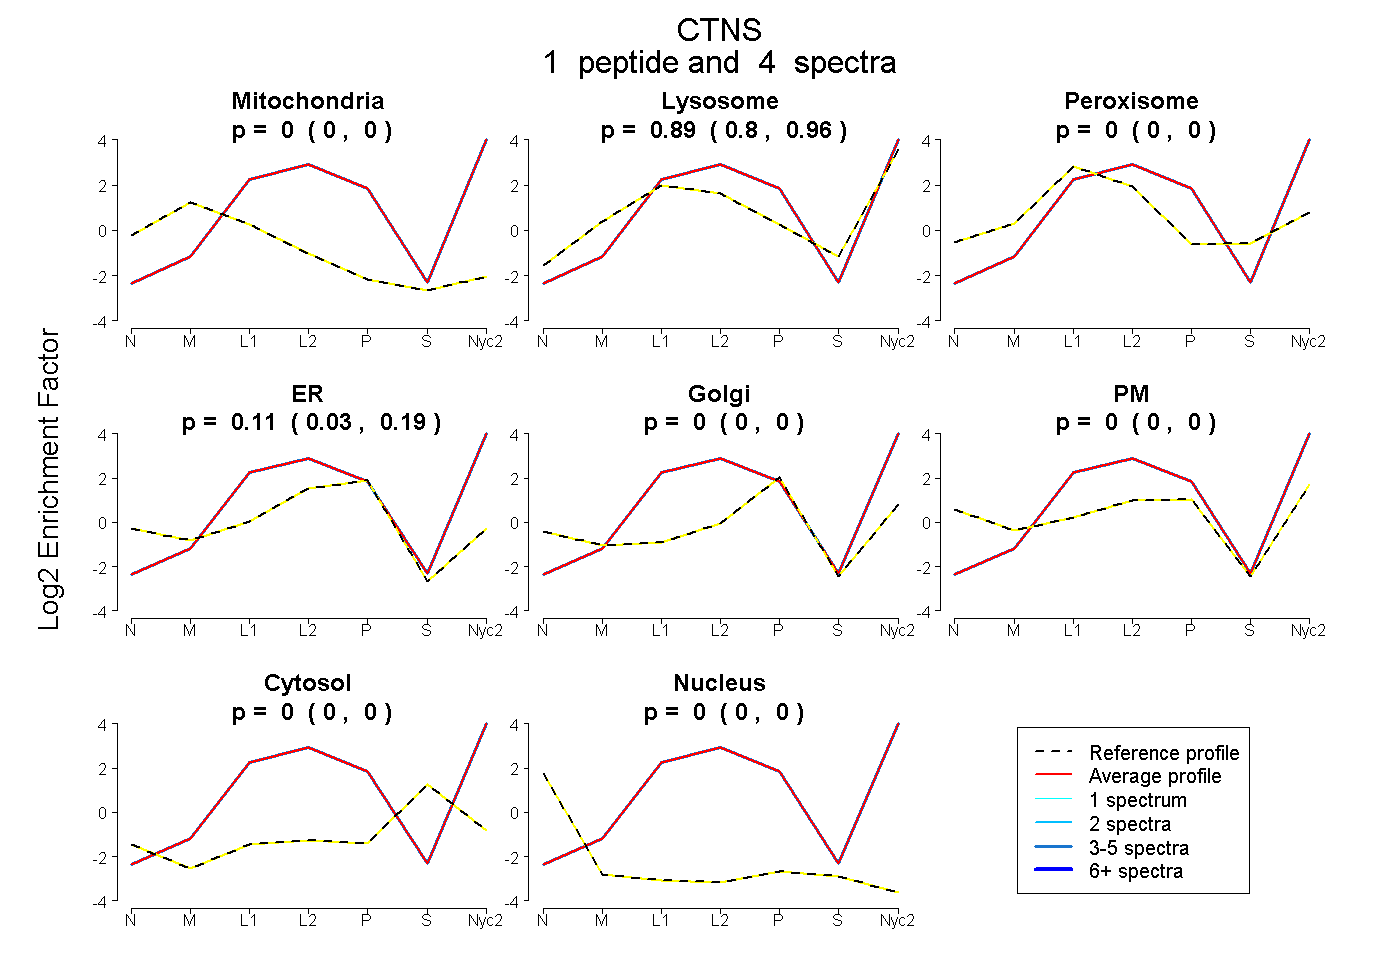
0.000 | 0.000
0.800 | 0.960
0.000 | 0.000
0.026 | 0.187
0.000 | 0.000
0.000 | 0.000
0.000 | 0.000
0.000 | 0.000
1peptide
spectra
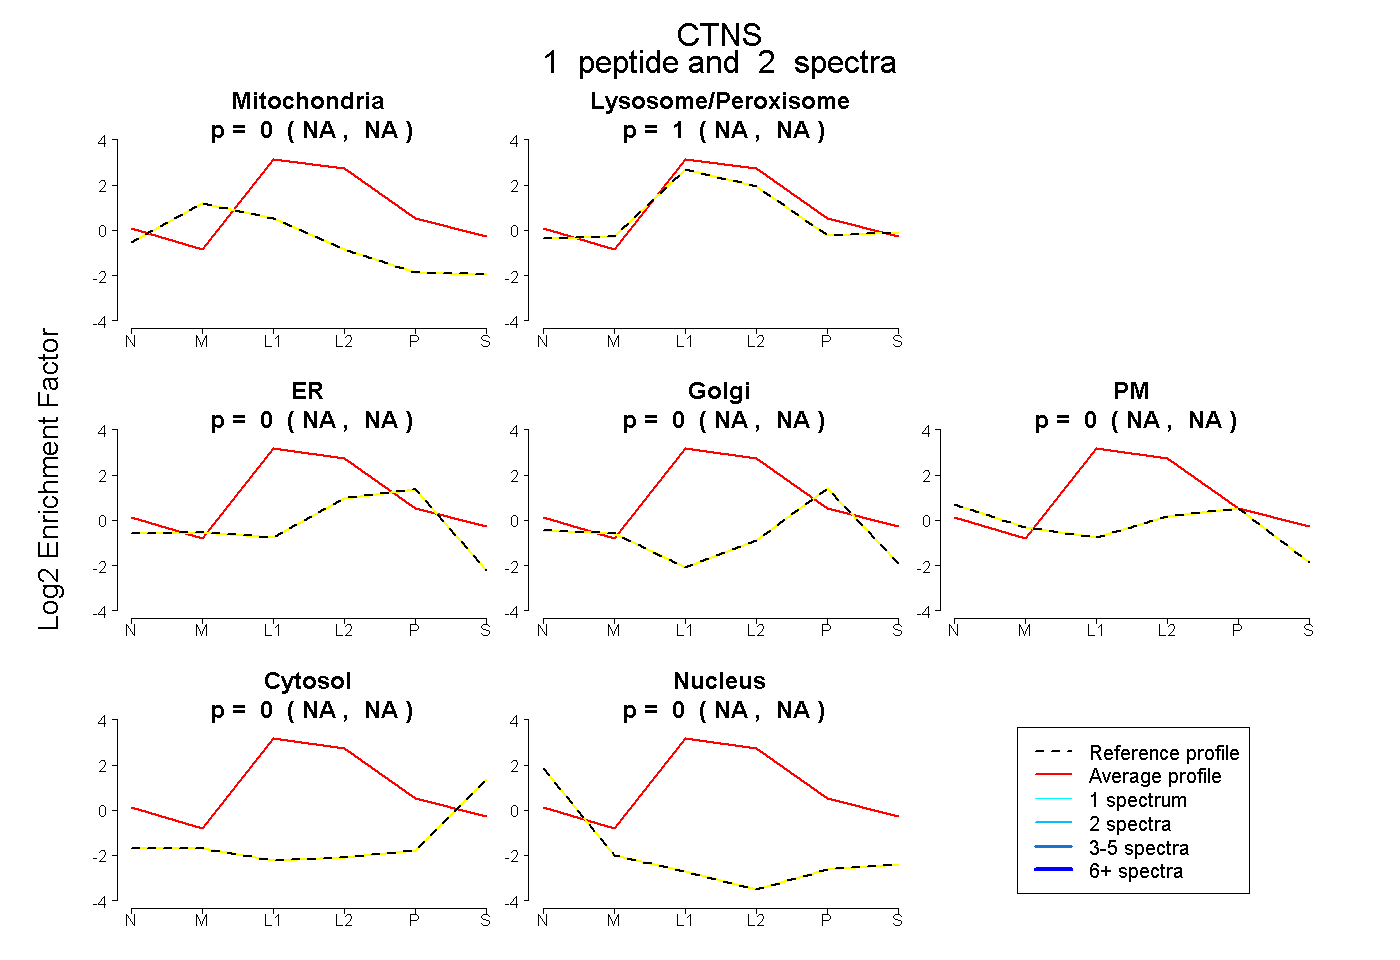
NA | NA
NA | NA
NA | NA
NA | NA
NA | NA
NA | NA
NA | NA
1peptide
spectra
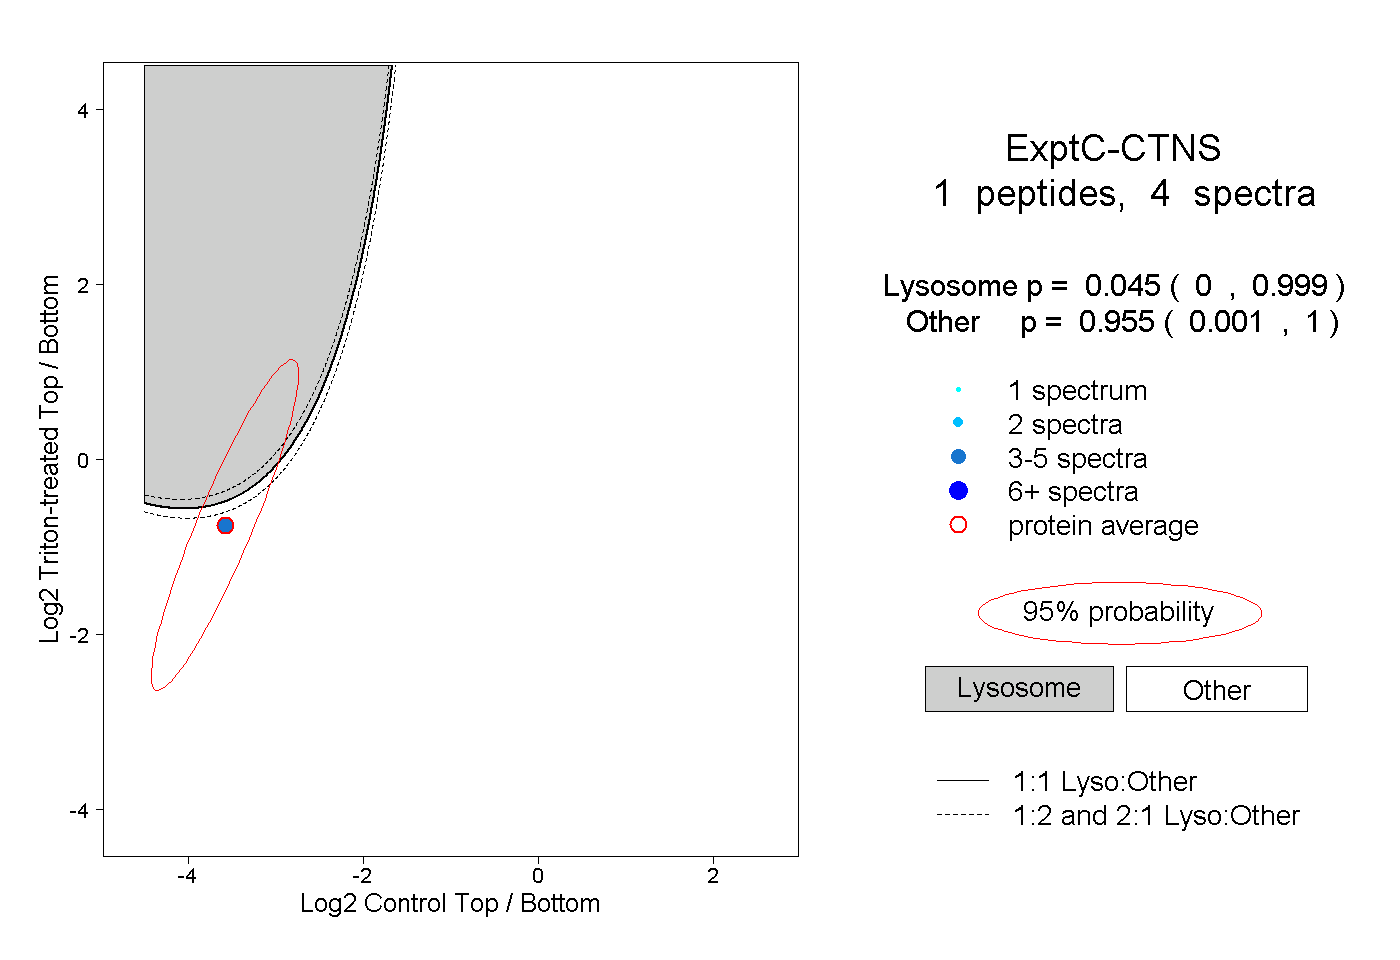
0.000 | 0.999
0.001 | 1.000