 3
3peptides
spectra
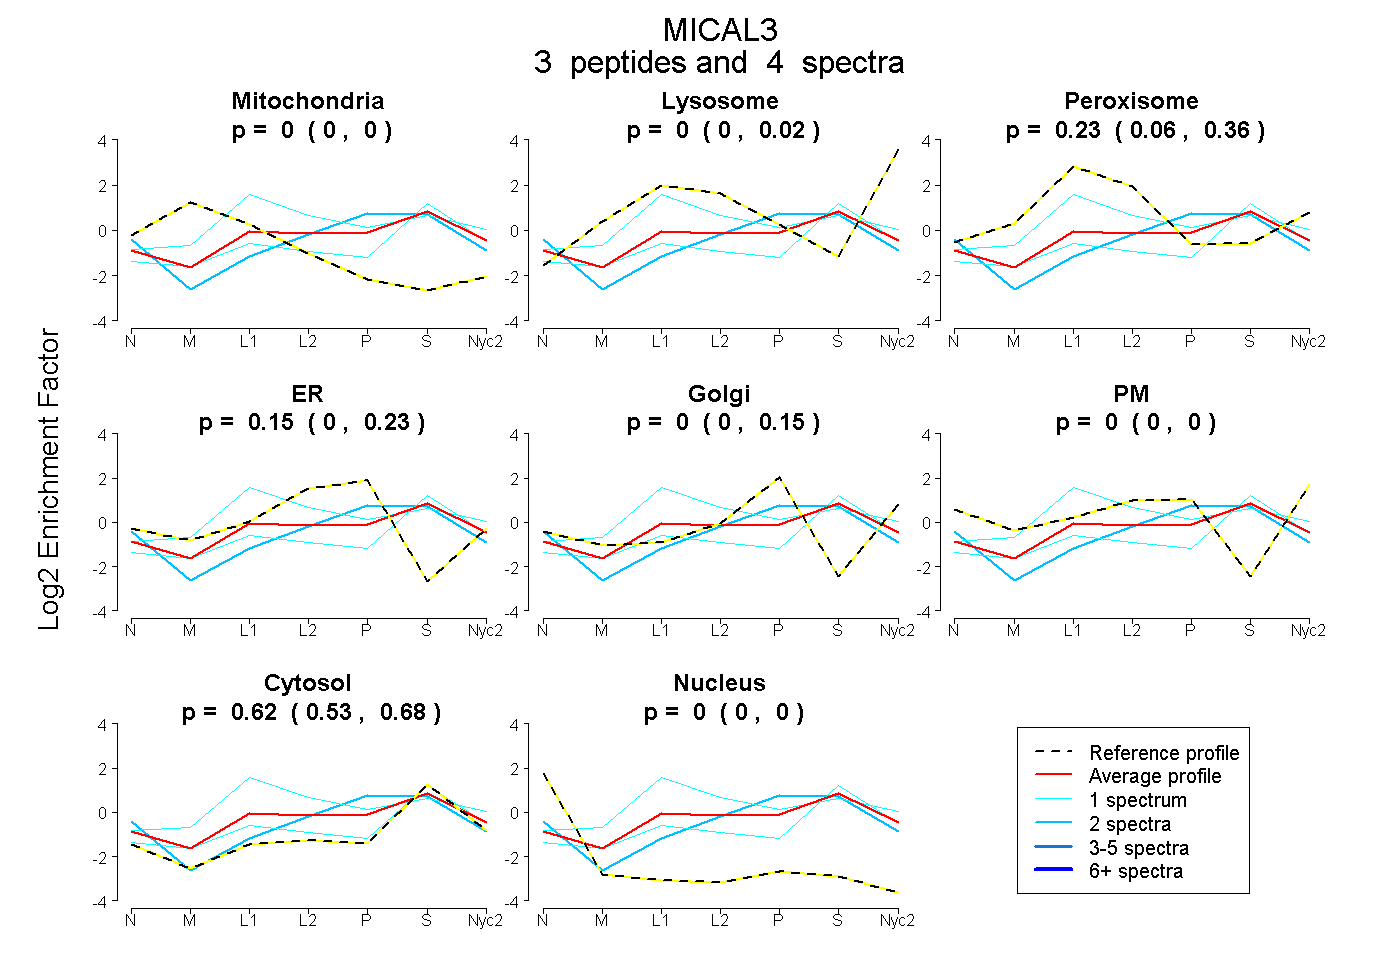
0.000 | 0.000
0.000 | 0.022
0.062 | 0.361
0.000 | 0.232
0.000 | 0.153
0.000 | 0.000
0.526 | 0.684
0.000 | 0.000
| Plot | Mito | Lyso | Perox | ER | Golgi | PM | Cytosol | Nucleus | |||||
| Expt A |
3 peptides |
4 spectra |
|
0.000 0.000 | 0.000 |
0.000 0.000 | 0.022 |
0.231 0.062 | 0.361 |
0.150 0.000 | 0.232 |
0.000 0.000 | 0.153 |
0.000 0.000 | 0.000 |
0.619 0.526 | 0.684 |
0.000 0.000 | 0.000 |
| 1 spectrum, QTFER | 0.012 | 0.017 | 0.163 | 0.000 | 0.000 | 0.000 | 0.808 | 0.000 | ||
| 1 spectrum, SDLVEEFWMK | 0.000 | 0.000 | 0.618 | 0.034 | 0.019 | 0.000 | 0.329 | 0.000 | ||
| 2 spectra, ELELEDR | 0.000 | 0.000 | 0.000 | 0.311 | 0.028 | 0.000 | 0.660 | 0.000 |
| Plot | Lyso | Other | |||||||||||
| Expt C |
2 peptides |
2 spectra |
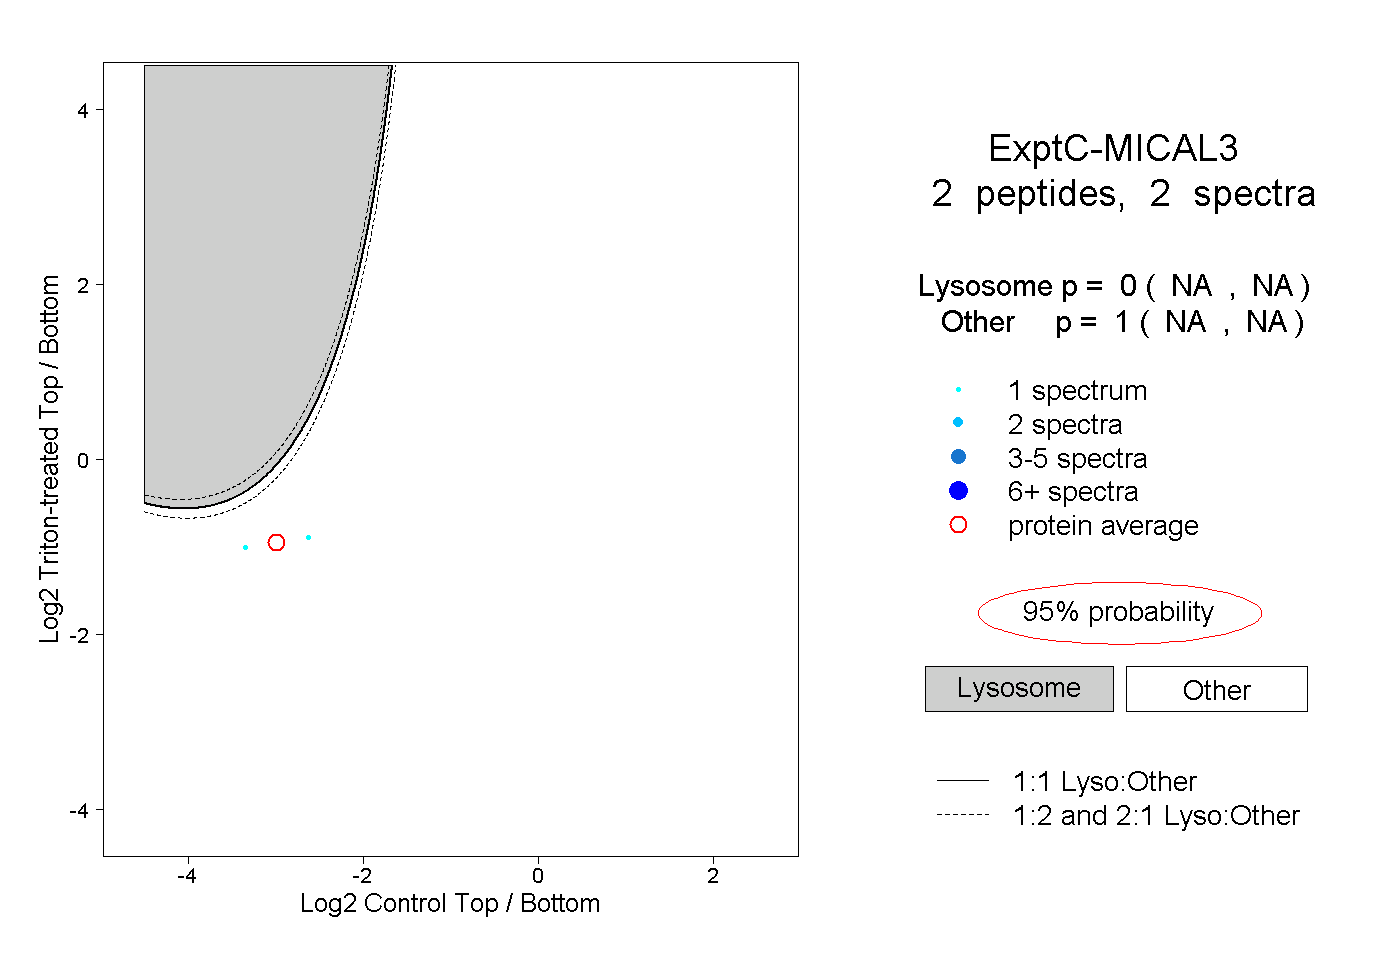 |
0.000 NA | NA |
1.000 NA | NA |