 3
3peptides
spectra
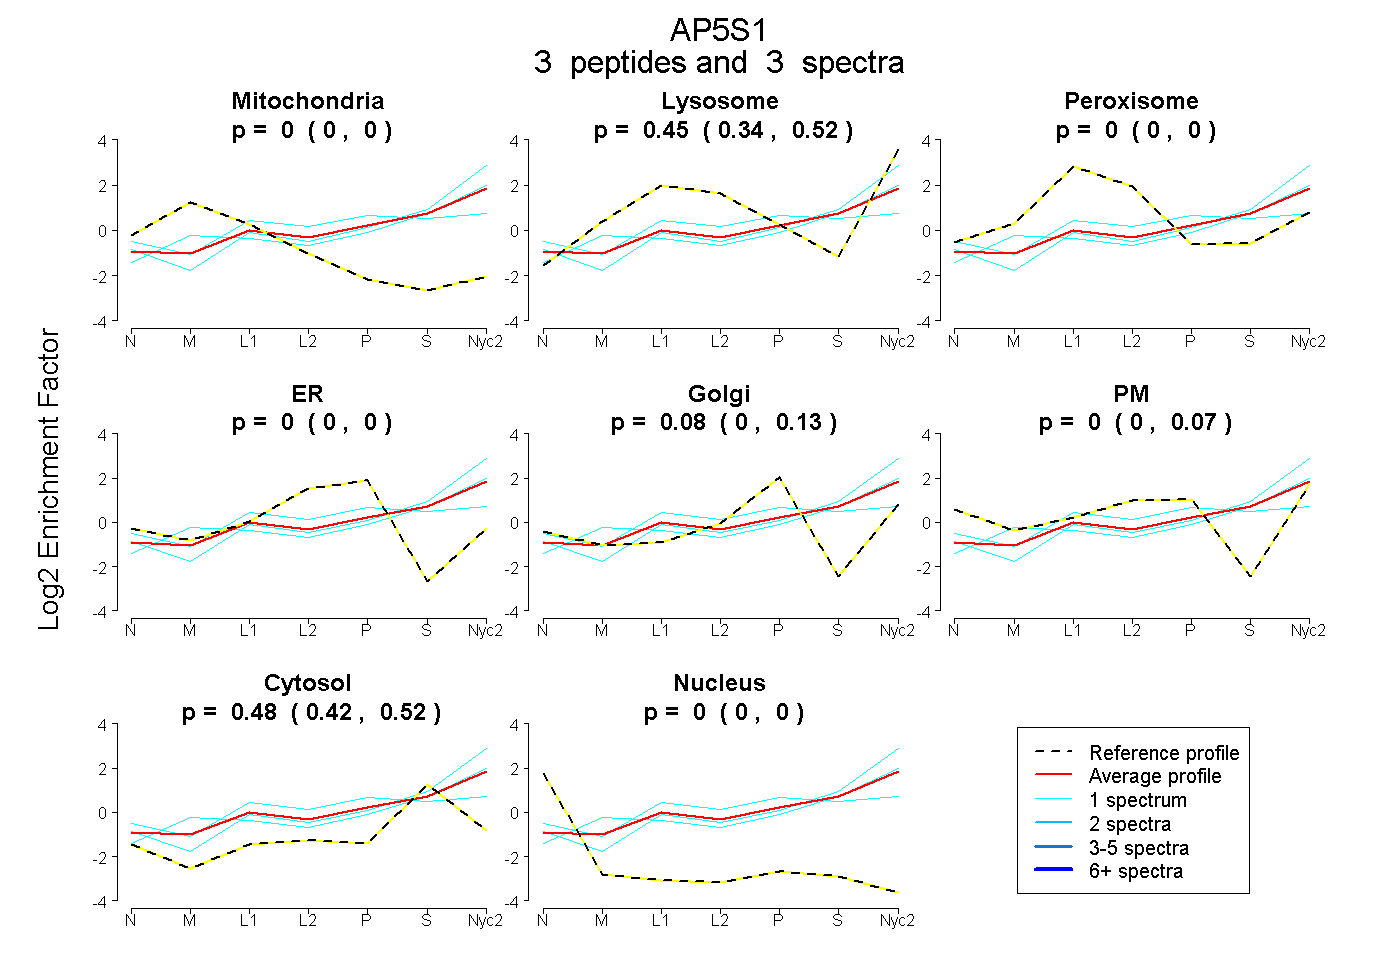
0.000 | 0.000
0.337 | 0.520
0.000 | 0.000
0.000 | 0.000
0.000 | 0.128
0.000 | 0.073
0.424 | 0.524
0.000 | 0.000
1peptide
spectrum
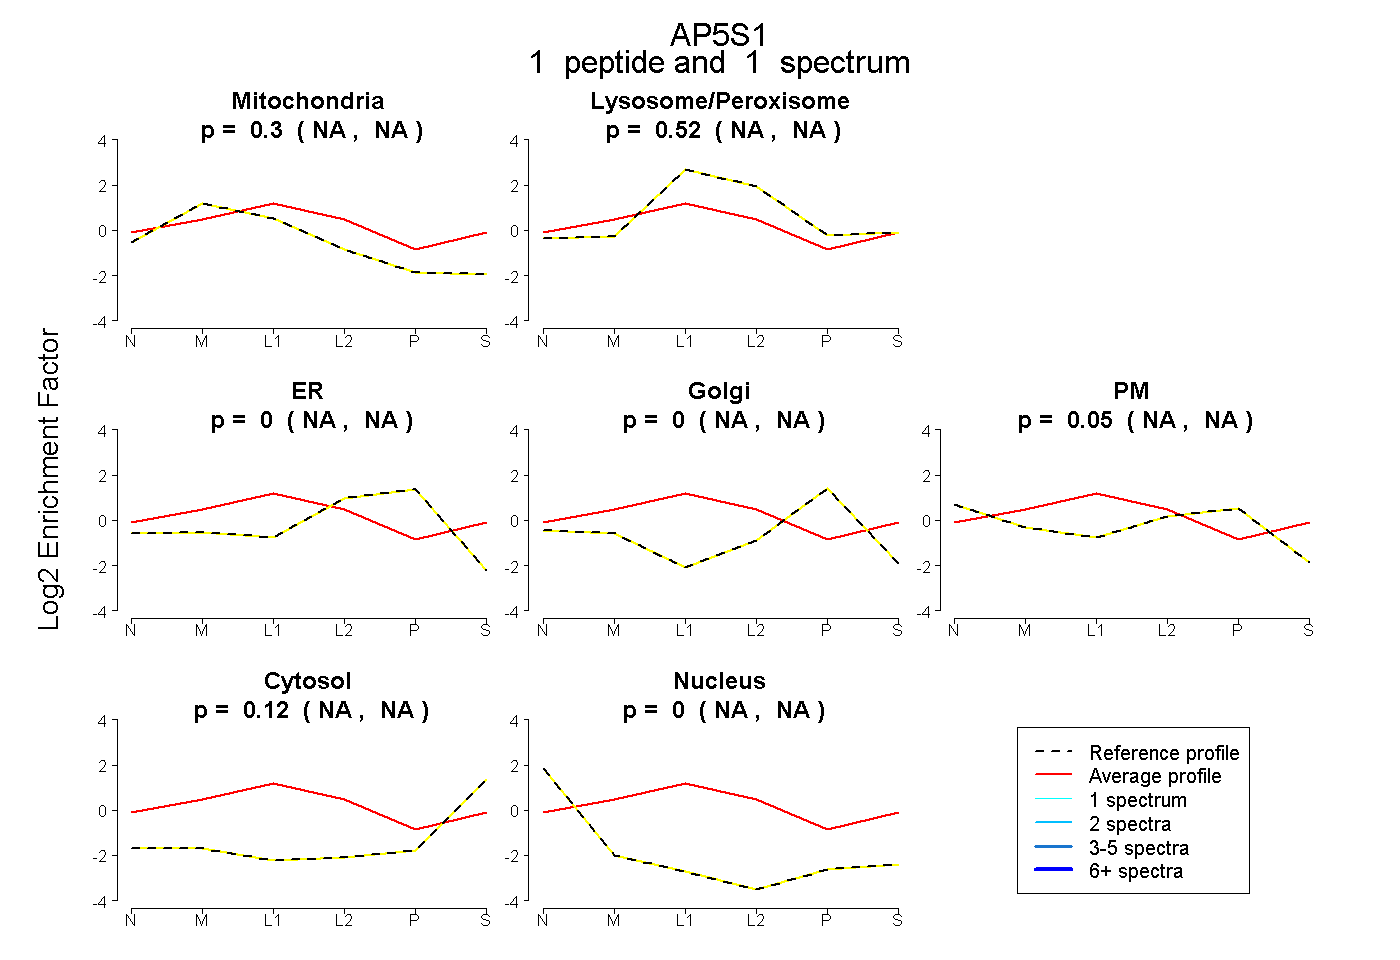
NA | NA
NA | NA
NA | NA
NA | NA
NA | NA
NA | NA
NA | NA
3peptides
spectra
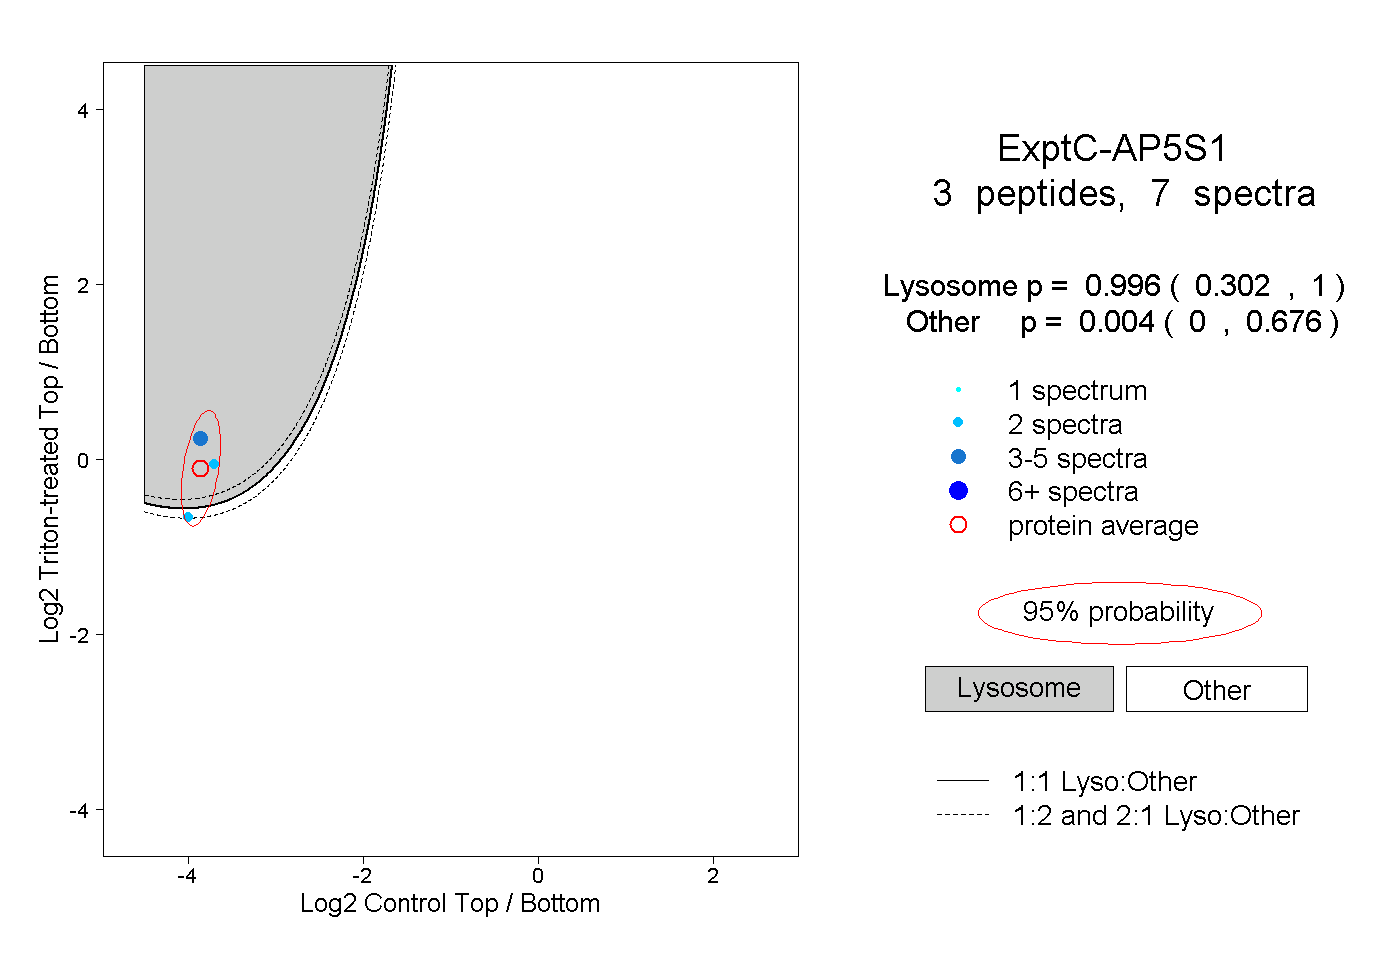
0.302 | 1.000
0.000 | 0.676