 1
1peptide
spectra
0.000 | 0.000
0.000 | 0.000
0.000 | 0.000
0.000 | 0.064
0.675 | 0.804
0.000 | 0.093
0.084 | 0.135
0.061 | 0.100
1peptide
spectra
NA | NA
NA | NA
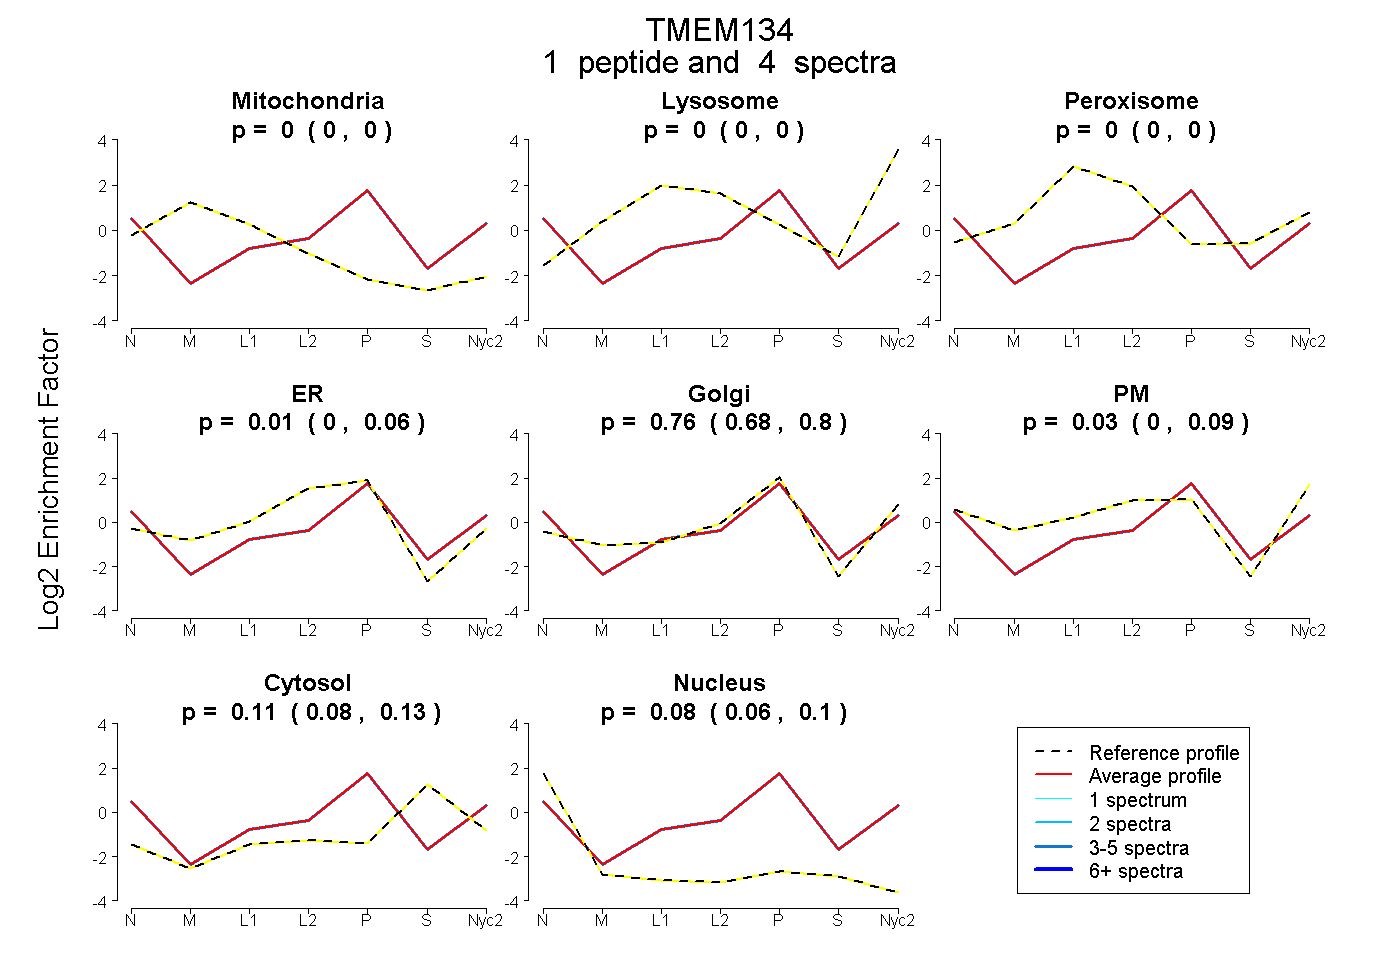
| Plot | Mito | Lyso | Perox | ER | Golgi | PM | Cytosol | Nucleus | |||||
| Expt A |
1 peptide |
4 spectra |
|
0.000 0.000 | 0.000 |
0.000 0.000 | 0.000 |
0.000 0.000 | 0.000 |
0.013 0.000 | 0.064 |
0.760 0.675 | 0.804 |
0.033 0.000 | 0.093 |
0.111 0.084 | 0.135 |
0.082 0.061 | 0.100 |
||
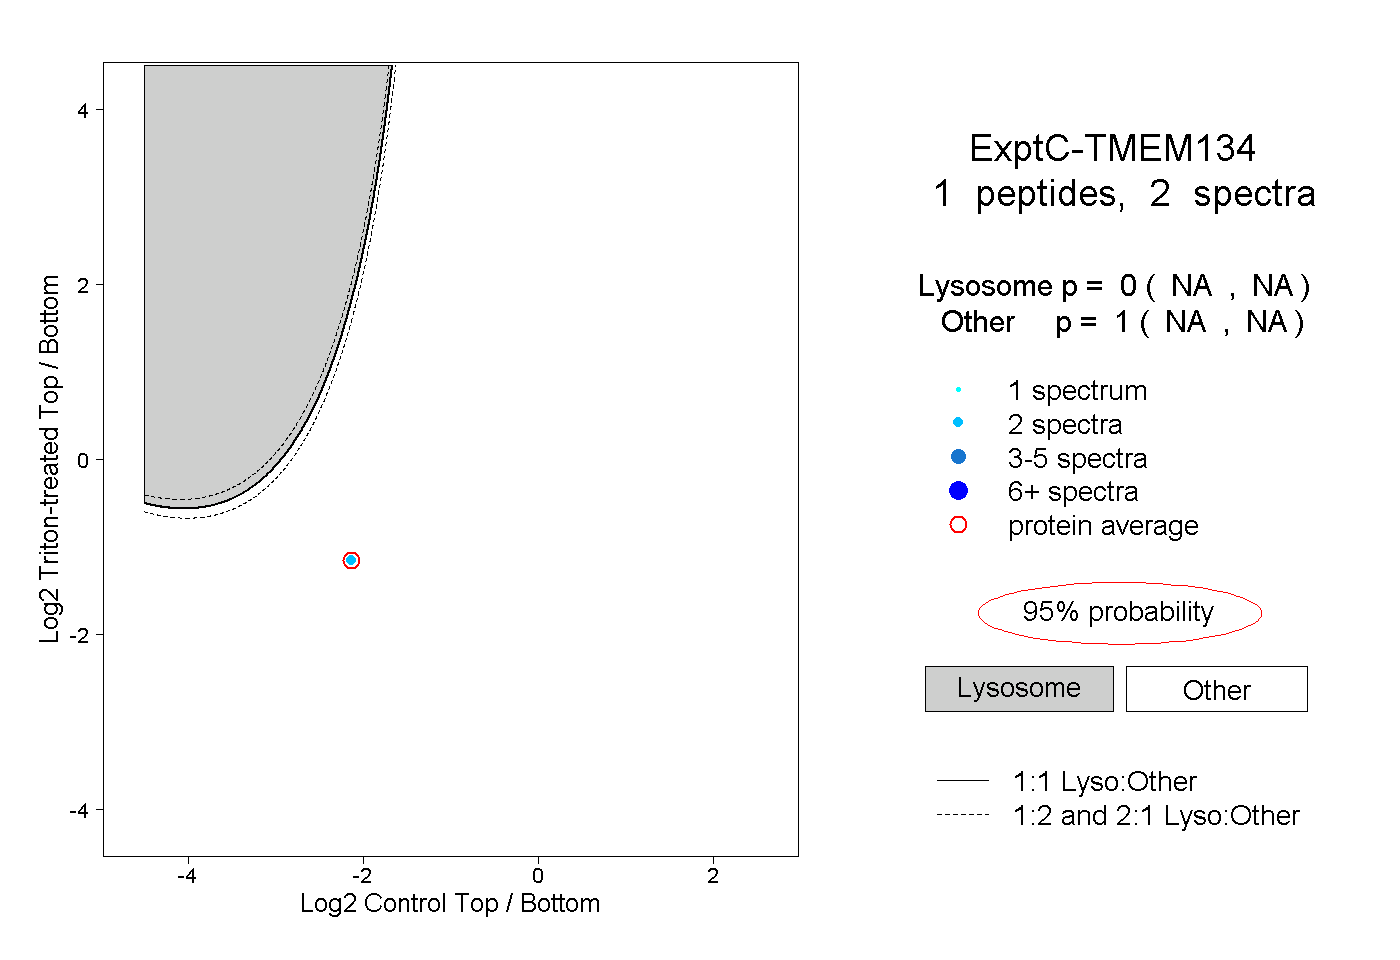
| Plot | Lyso | Other | |||||||||||
| Expt C |
1 peptide |
2 spectra |
|
0.000 NA | NA |
1.000 NA | NA |