 8
8peptides
spectra

0.963 | 0.976
0.000 | 0.000
0.000 | 0.000
0.000 | 0.000
0.000 | 0.000
0.000 | 0.000
0.000 | 0.000
0.022 | 0.036
6peptides
spectra
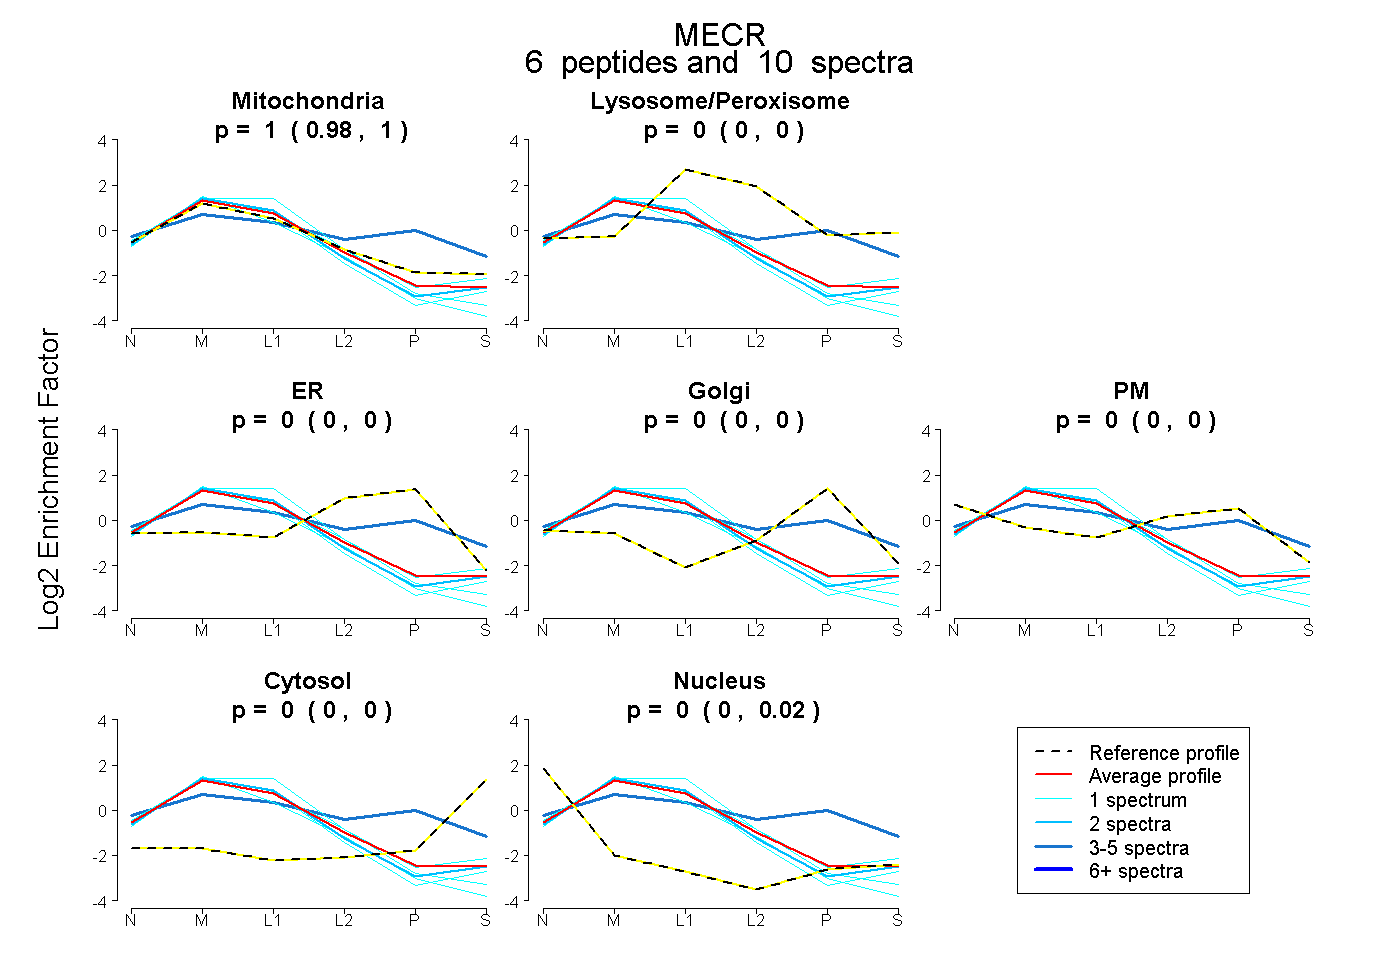
0.983 | 1.000
0.000 | 0.000
0.000 | 0.000
0.000 | 0.000
0.000 | 0.000
0.000 | 0.000
0.000 | 0.015
11peptides
spectra
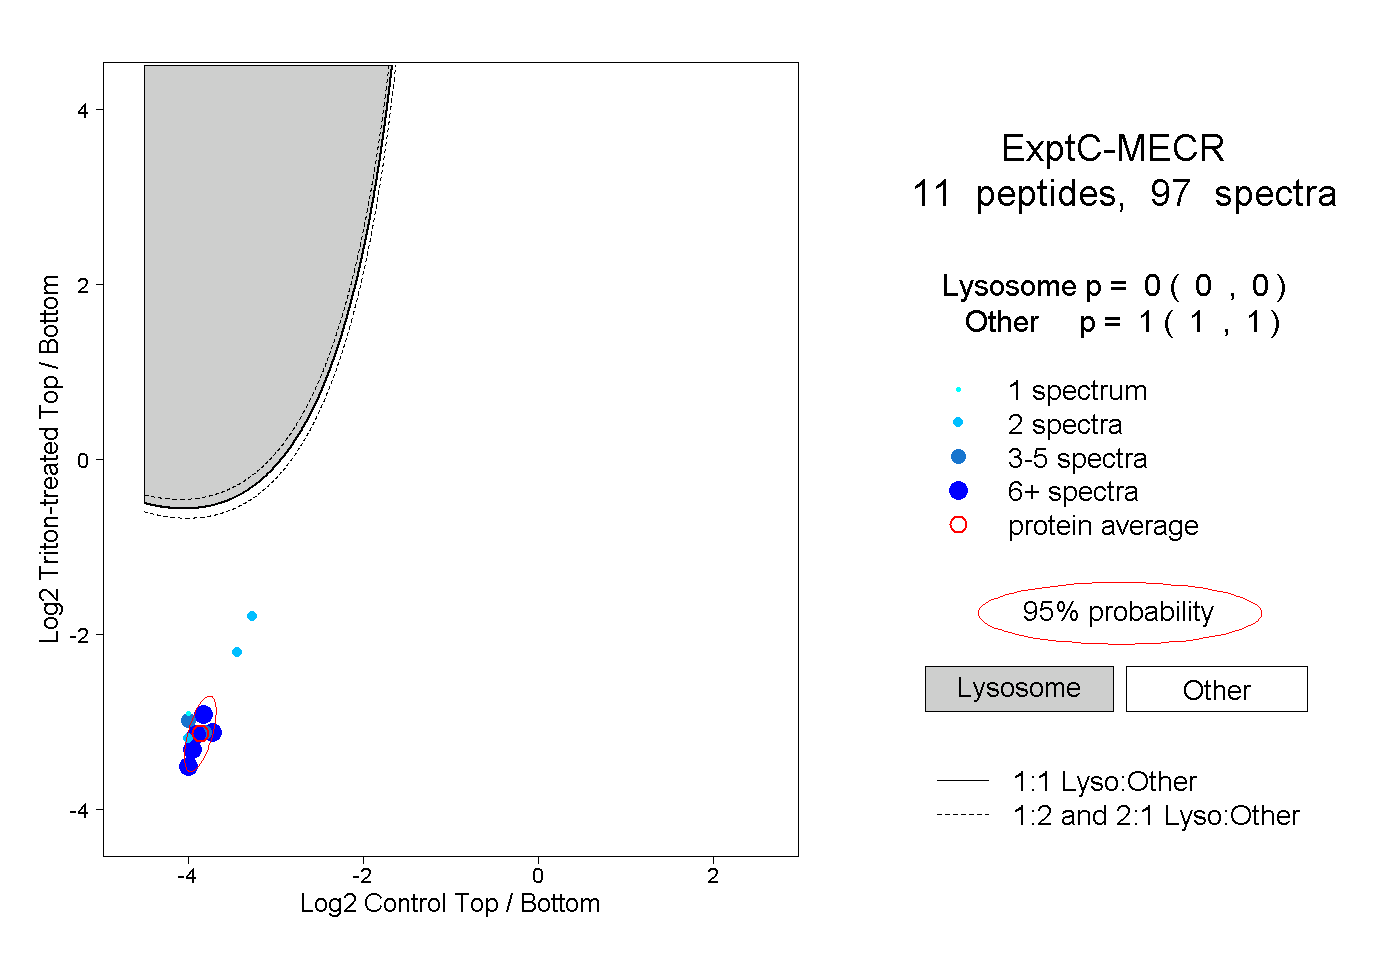
0.000 | 0.000
1.000 | 1.000
