MECR
[ENSRNOP00000031375]
Main page
| | | Plot |
Mito |
Lyso |
|
Perox |
ER |
Golgi |
PM |
Cytosol |
Nucleus |
|
| Expt A |
 8
8
peptides |
28
spectra |
 |
0.970
0.963 | 0.976 |
0.000
0.000 | 0.000 |
|
0.000
0.000 | 0.000 |
0.000
0.000 | 0.000 |
0.000
0.000 | 0.000 |
0.000
0.000 | 0.000 |
0.000
0.000 | 0.000 |
0.030
0.022 | 0.036 |
|
| | | Plot |
Mito |
|
Lyso or Perox |
|
ER |
Golgi |
PM |
Cytosol |
Nucleus |
|
| Expt B |
6
peptides |
10
spectra |
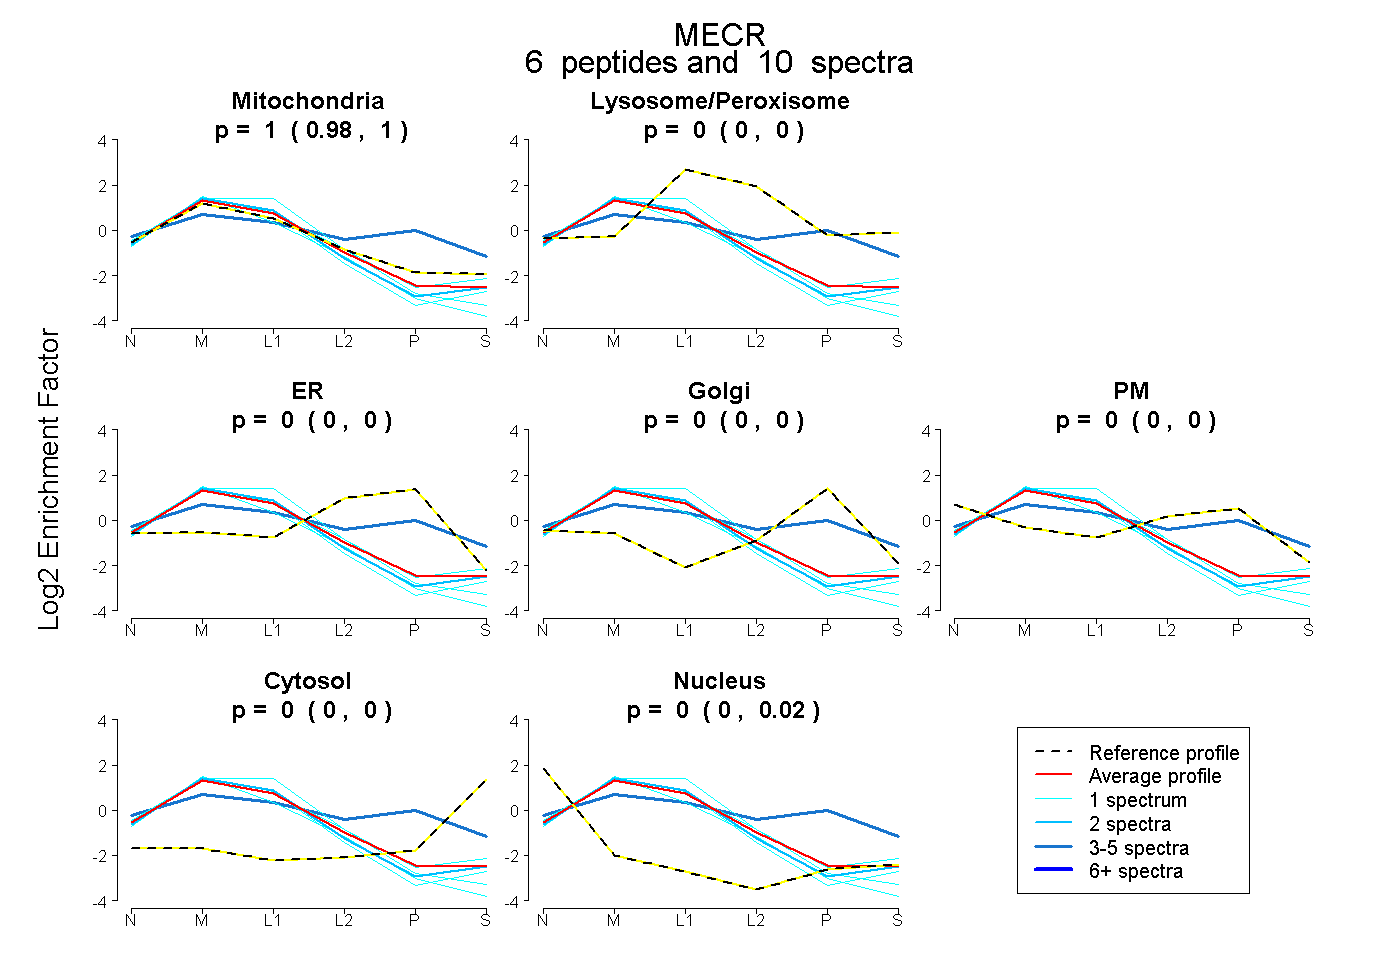 |
0.999
0.983 | 1.000 |
|
0.000
0.000 | 0.000 |
|
0.000
0.000 | 0.000 |
0.000
0.000 | 0.000 |
0.000
0.000 | 0.000 |
0.000
0.000 | 0.000 |
0.001
0.000 | 0.015 |
|
| 1 spectrum, SSTELLR |
0.950 |
|
0.000 |
|
0.000 |
0.000 |
0.000 |
0.000 |
0.050 |
|
| 1 spectrum, DLPLPR |
0.970 |
|
0.000 |
|
0.000 |
0.000 |
0.000 |
0.000 |
0.030 |
|
| 1 spectrum, GFWLSQWK |
1.000 |
|
0.000 |
|
0.000 |
0.000 |
0.000 |
0.000 |
0.000 |
|
| 4 spectra, ALVYGNHGDPAK |
0.412 |
|
0.255 |
|
0.000 |
0.333 |
0.000 |
0.000 |
0.000 |
|
| 2 spectra, TINVIR |
0.994 |
|
0.000 |
|
0.000 |
0.000 |
0.000 |
0.000 |
0.006 |
|
| 1 spectrum, LALNCVGGK |
1.000 |
|
0.000 |
|
0.000 |
0.000 |
0.000 |
0.000 |
0.000 |
|
| | | Plot |
|
Lyso |
|
|
|
|
|
|
|
Other |
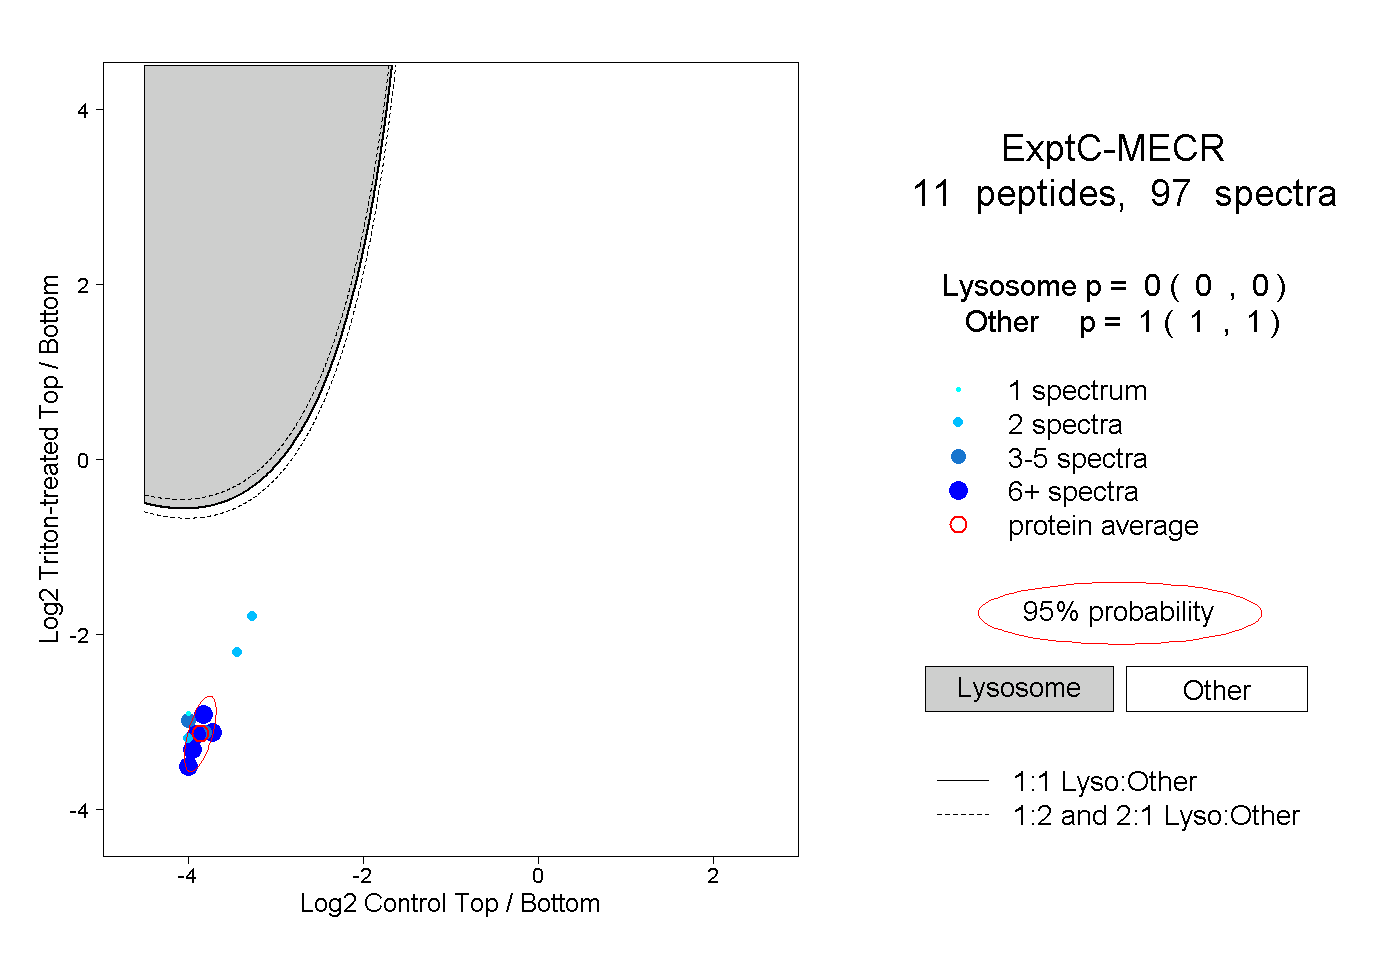
| Expt C |
11
peptides |
97
spectra |
 |
|
0.000
0.000 | 0.000 |
|
|
|
|
|
|
|
1.000
1.000 | 1.000 |
| | | Plot |
|
Lyso |
|
|
|
|
|
|
|
Other |
| Expt D |
5
peptides |
11
spectra |
 |
|
0.000
0.000 | 0.000 |
|
|
|
|
|
|
|
1.000
1.000 | 1.000 |