 8
8peptides
spectra

0.963 | 0.976
0.000 | 0.000
0.000 | 0.000
0.000 | 0.000
0.000 | 0.000
0.000 | 0.000
0.000 | 0.000
0.022 | 0.036
| Plot | Mito | Lyso | Perox | ER | Golgi | PM | Cytosol | Nucleus | |||||
| Expt A |
8 peptides |
28 spectra |
|
0.970 0.963 | 0.976 |
0.000 0.000 | 0.000 |
0.000 0.000 | 0.000 |
0.000 0.000 | 0.000 |
0.000 0.000 | 0.000 |
0.000 0.000 | 0.000 |
0.000 0.000 | 0.000 |
0.030 0.022 | 0.036 |
| 2 spectra, SSTELLR | 0.921 | 0.000 | 0.000 | 0.000 | 0.000 | 0.000 | 0.000 | 0.079 | ||
| 5 spectra, QPVTASVSMLIFK | 0.632 | 0.037 | 0.000 | 0.000 | 0.167 | 0.163 | 0.000 | 0.000 | ||
| 9 spectra, HLAPGGTMVTYGGMAK | 0.972 | 0.000 | 0.000 | 0.000 | 0.000 | 0.000 | 0.000 | 0.028 | ||
| 2 spectra, DLPLPR | 0.912 | 0.017 | 0.000 | 0.000 | 0.000 | 0.000 | 0.056 | 0.015 | ||
| 1 spectrum, DLGADYVLTEEELR | 0.959 | 0.000 | 0.000 | 0.000 | 0.000 | 0.000 | 0.000 | 0.041 | ||
| 6 spectra, ALVYGNHGDPAK | 0.879 | 0.053 | 0.000 | 0.000 | 0.000 | 0.061 | 0.000 | 0.007 | ||
| 1 spectrum, TEAVFSEEALIGVPK | 0.856 | 0.000 | 0.000 | 0.000 | 0.000 | 0.000 | 0.000 | 0.144 | ||
| 2 spectra, LALNCVGGK | 0.882 | 0.000 | 0.000 | 0.000 | 0.000 | 0.000 | 0.000 | 0.118 |
| Plot | Mito | Lyso or Perox | ER | Golgi | PM | Cytosol | Nucleus | ||||||
| Expt B |
6 peptides |
10 spectra |
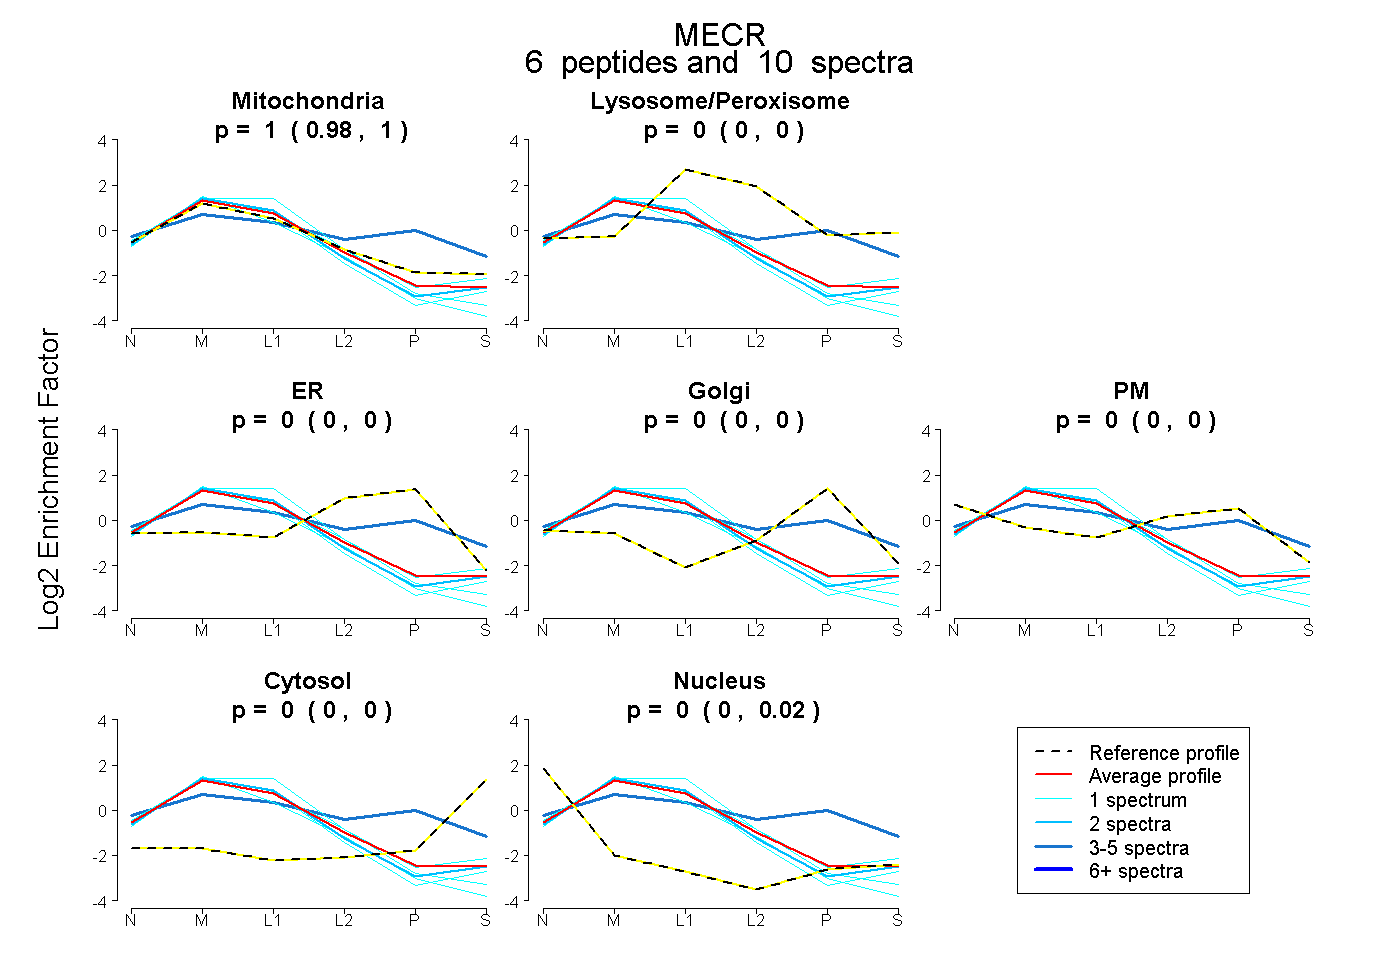 |
0.999 0.983 | 1.000 |
0.000 0.000 | 0.000 |
0.000 0.000 | 0.000 |
0.000 0.000 | 0.000 |
0.000 0.000 | 0.000 |
0.000 0.000 | 0.000 |
0.001 0.000 | 0.015 |
|||
| Plot | Lyso | Other | |||||||||||
| Expt C |
11 peptides |
97 spectra |
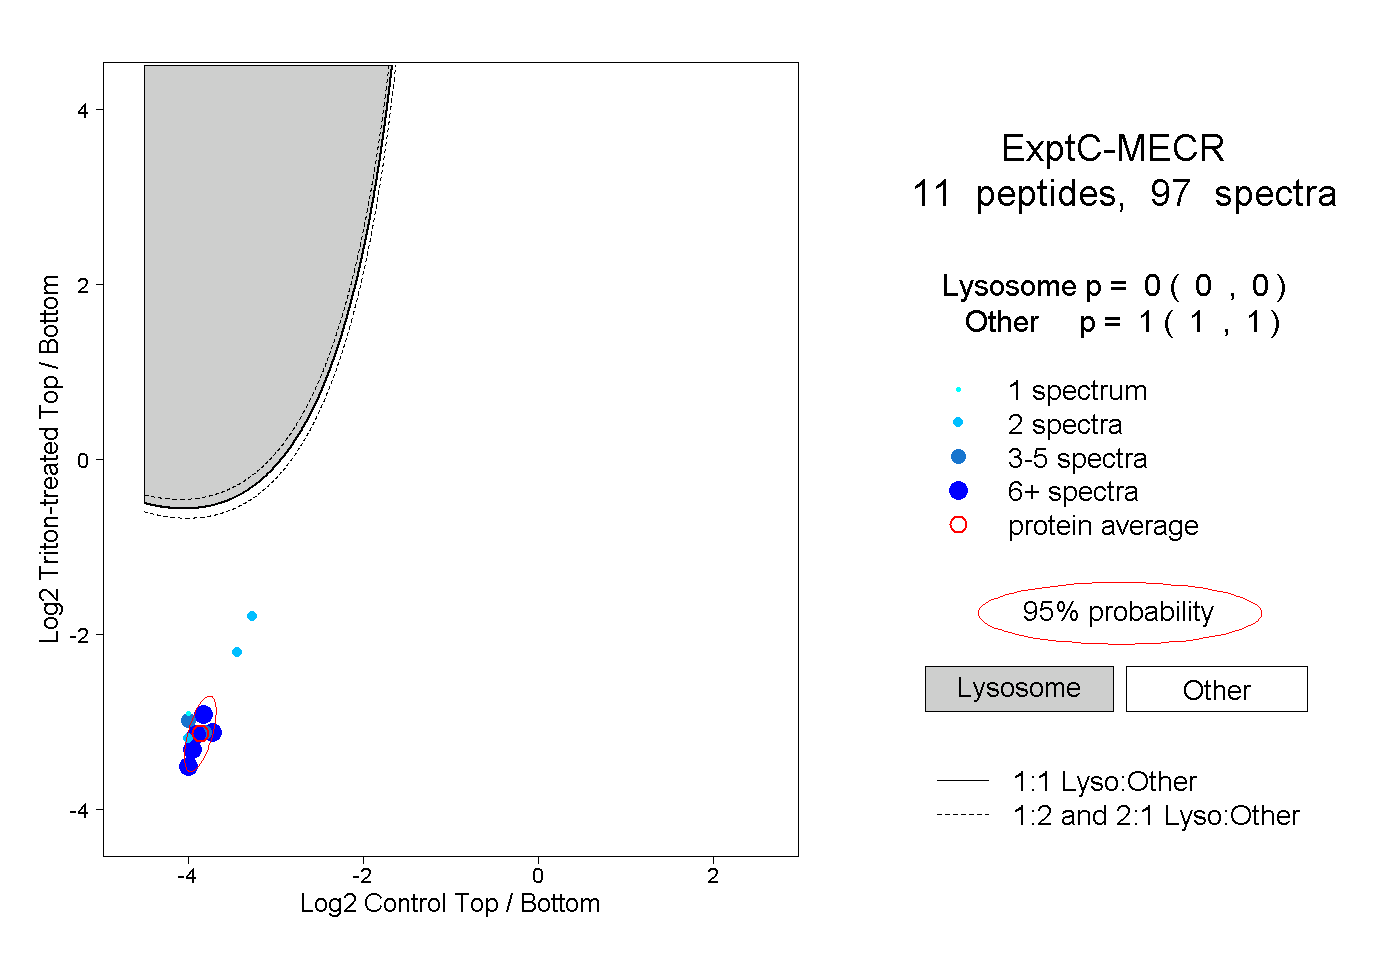 |
0.000 0.000 | 0.000 |
1.000 1.000 | 1.000 |
||||||||
| Plot | Lyso | Other | |||||||||||
| Expt D |
5 peptides |
11 spectra |
 |
0.000 0.000 | 0.000 |
1.000 1.000 | 1.000 |