 8
8peptides
spectra
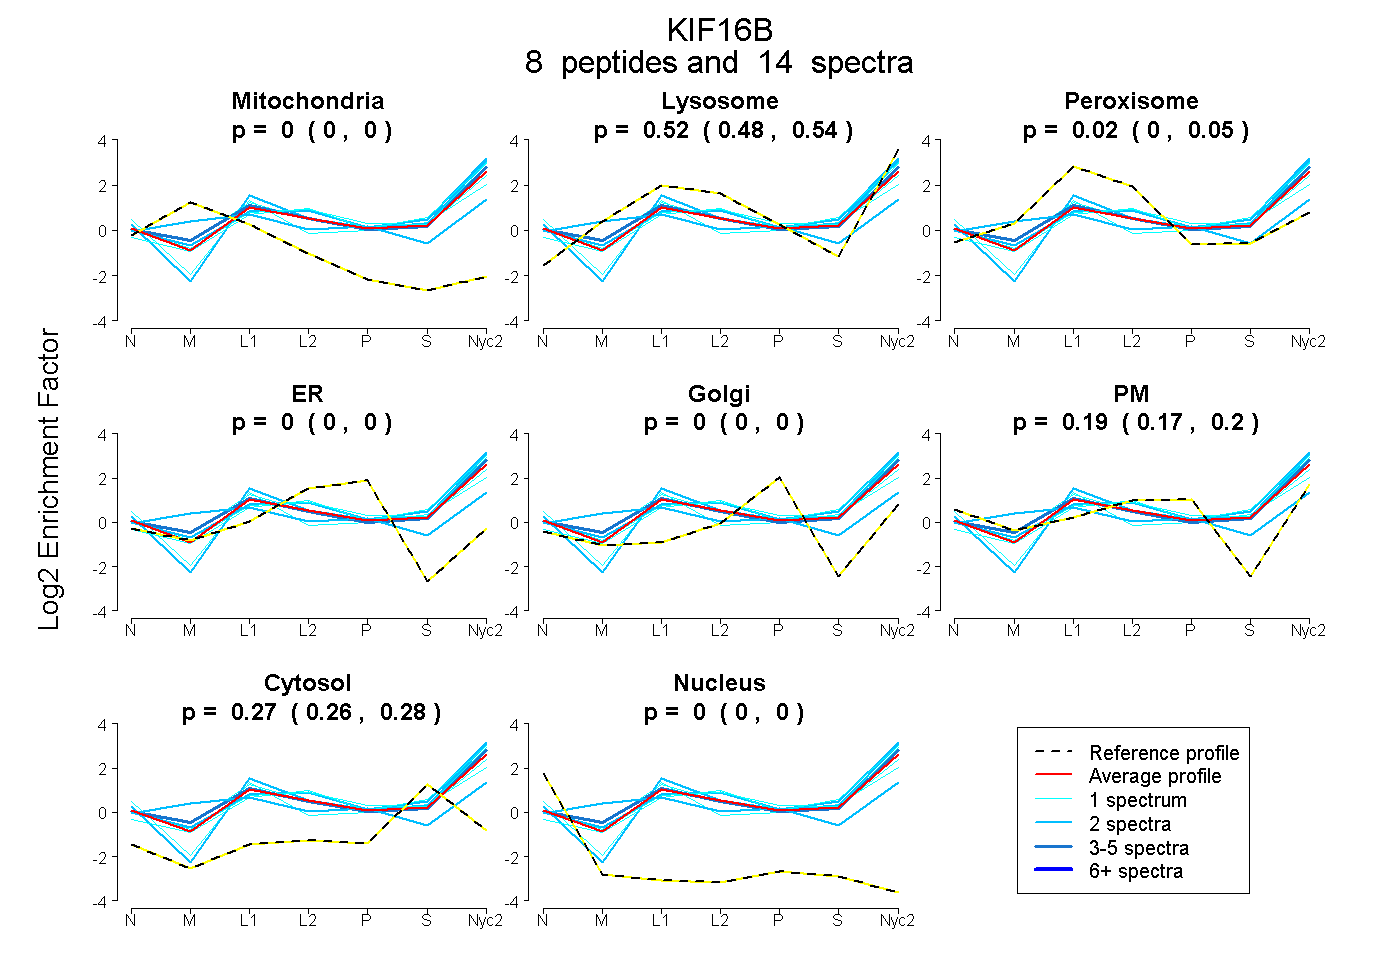
0.000 | 0.000
0.481 | 0.543
0.000 | 0.051
0.000 | 0.000
0.000 | 0.000
0.175 | 0.204
0.256 | 0.281
0.000 | 0.000
26peptides
spectra
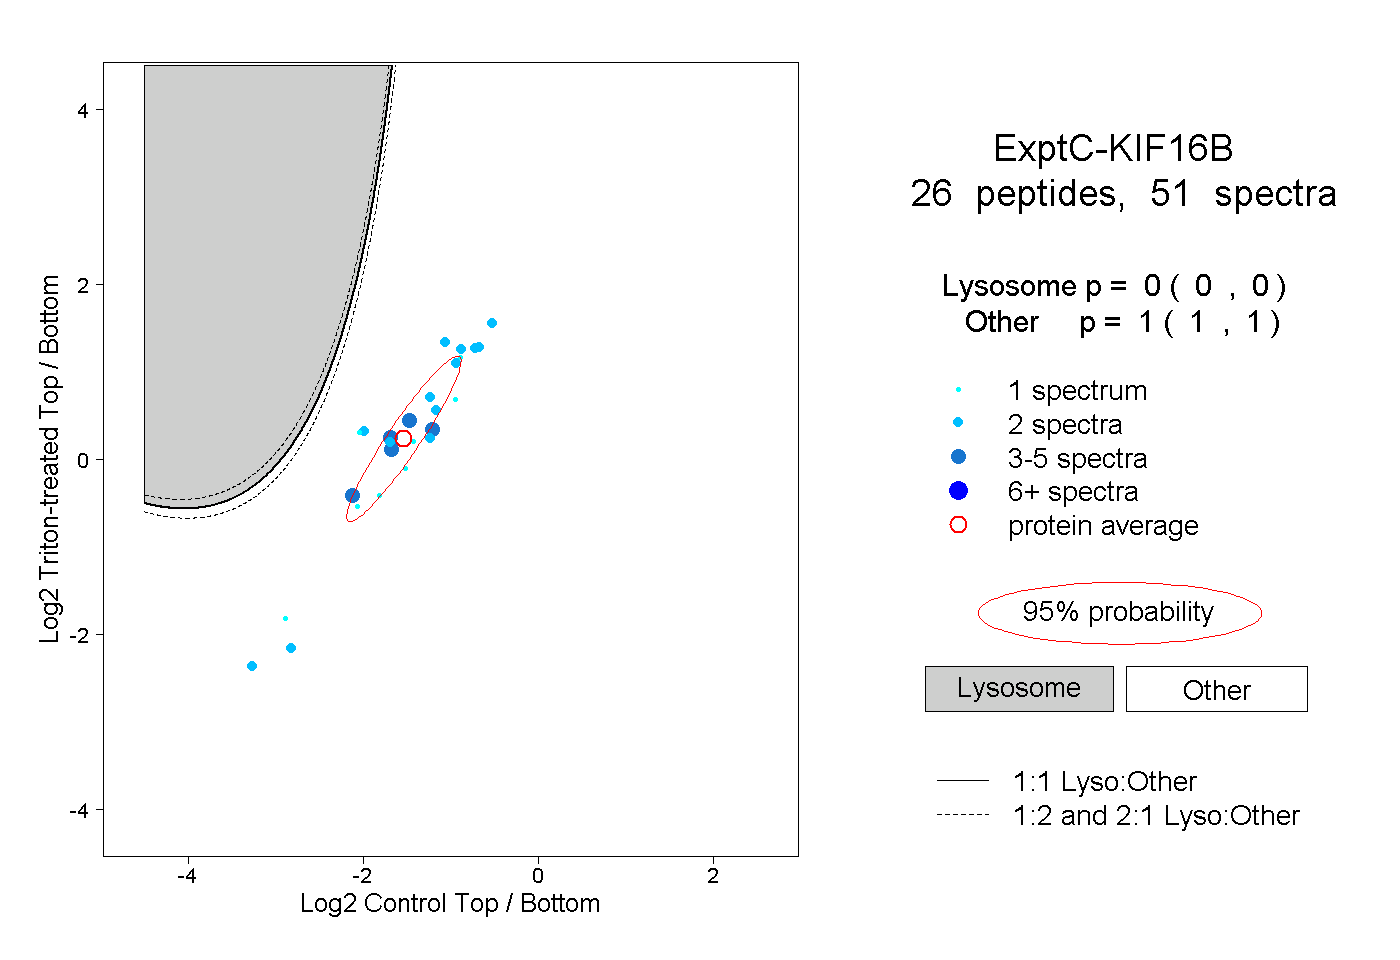
0.000 | 0.000
1.000 | 1.000
1peptide
spectrum
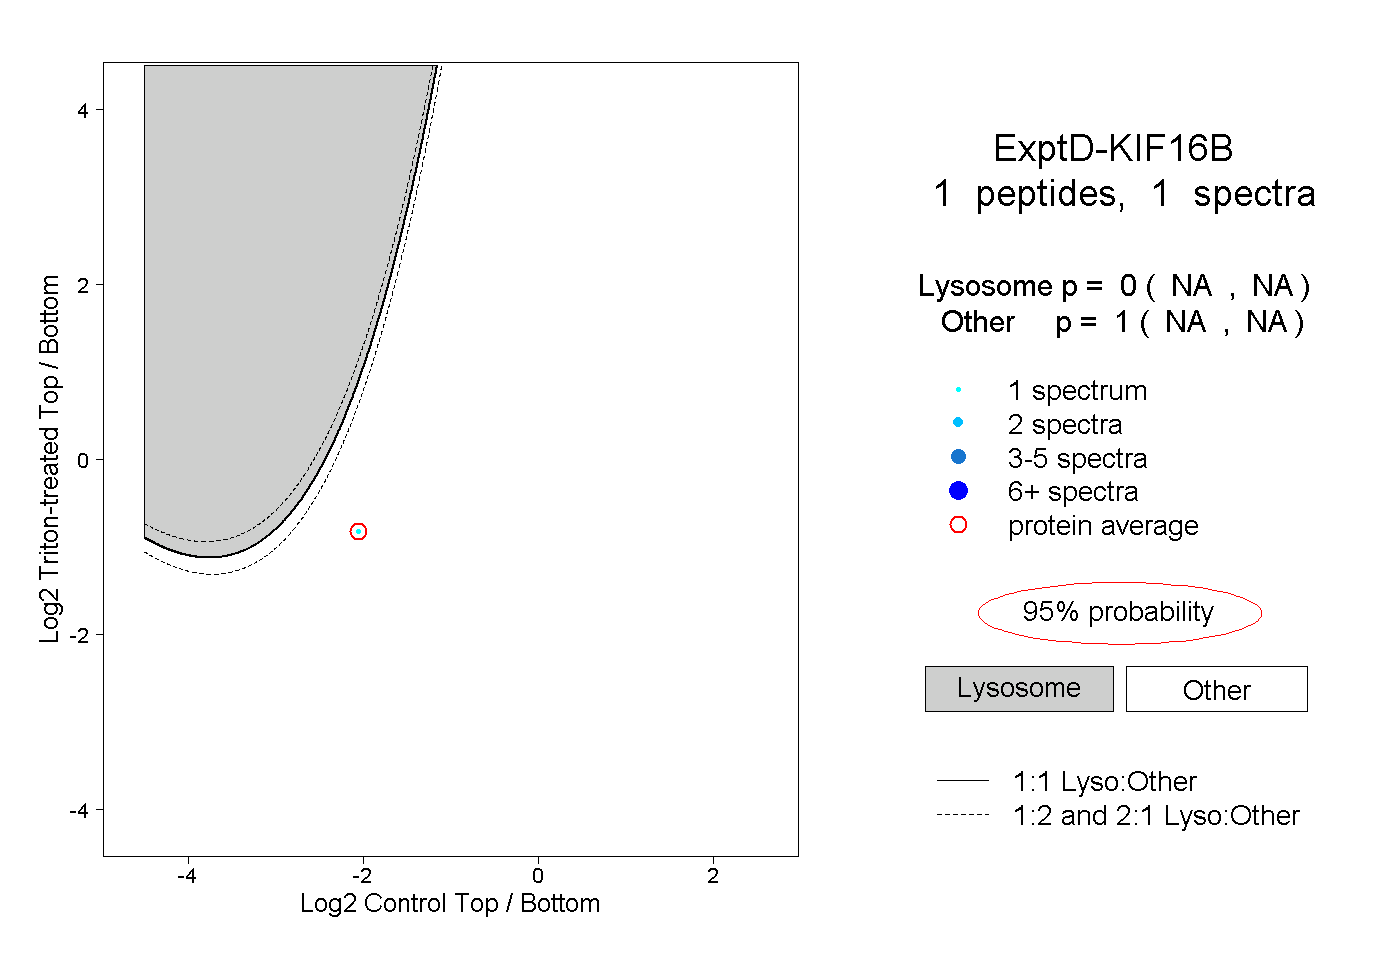
NA | NA
NA | NA