 1
1peptide
spectra
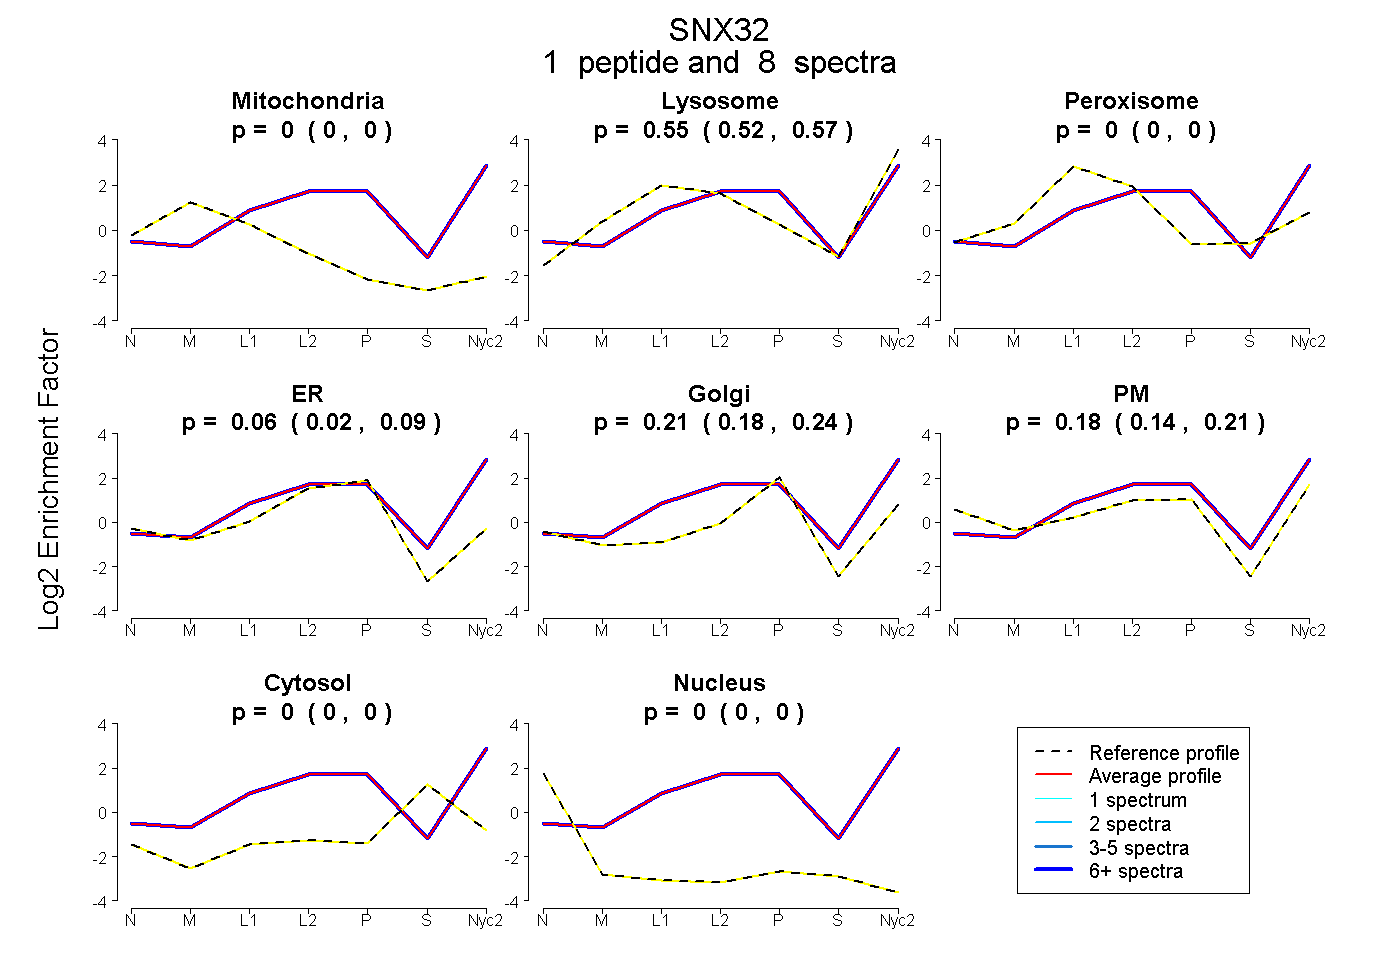
0.000 | 0.000
0.525 | 0.568
0.000 | 0.000
0.024 | 0.087
0.177 | 0.242
0.138 | 0.215
0.000 | 0.000
0.000 | 0.000
1peptide
spectra
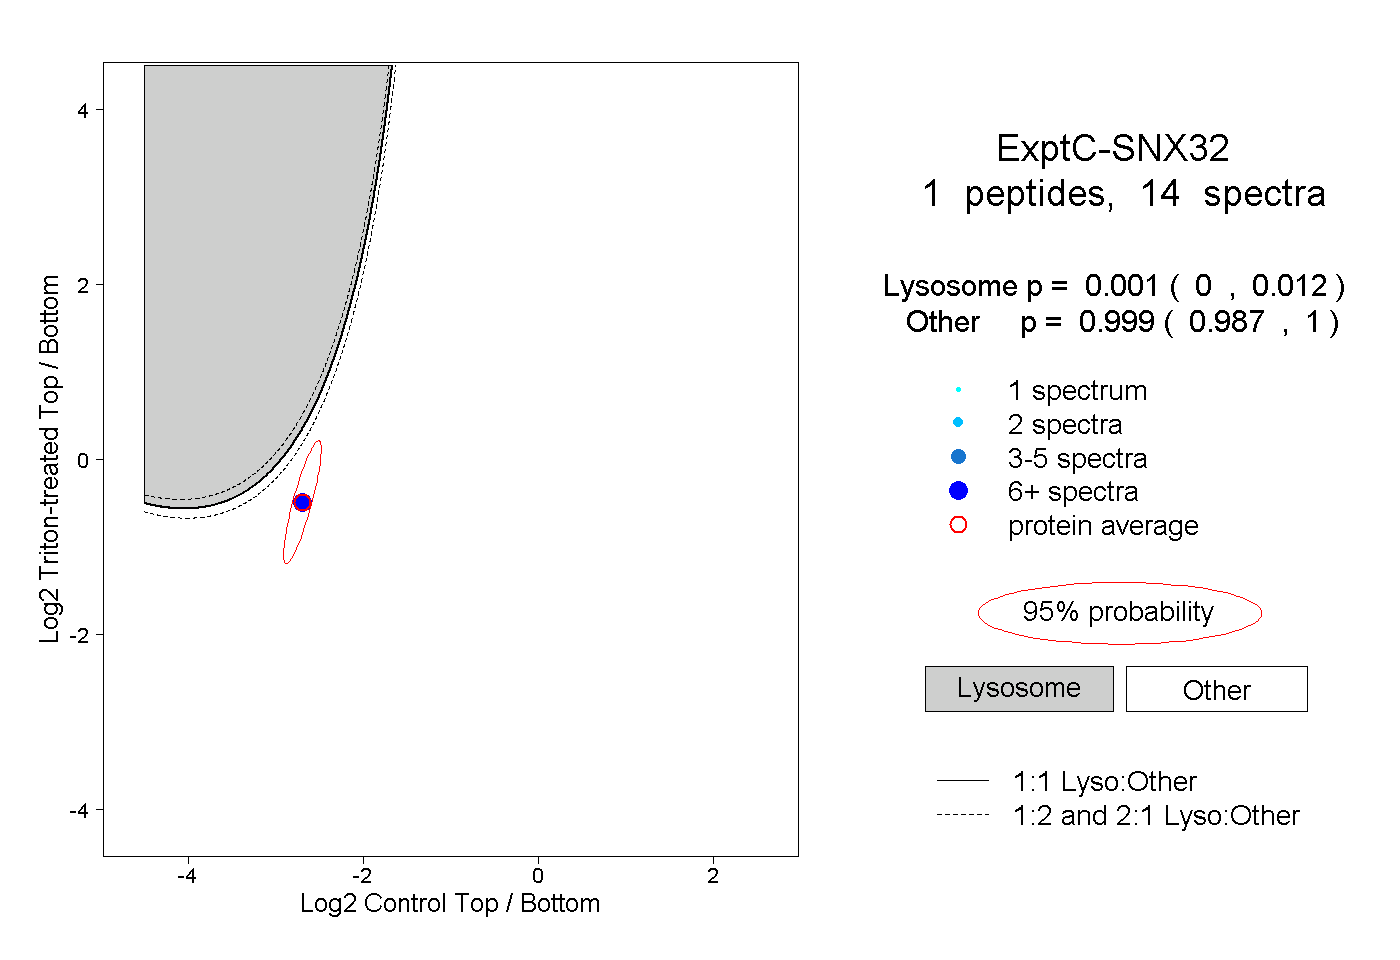
0.000 | 0.012
0.987 | 1.000
1peptide
spectrum
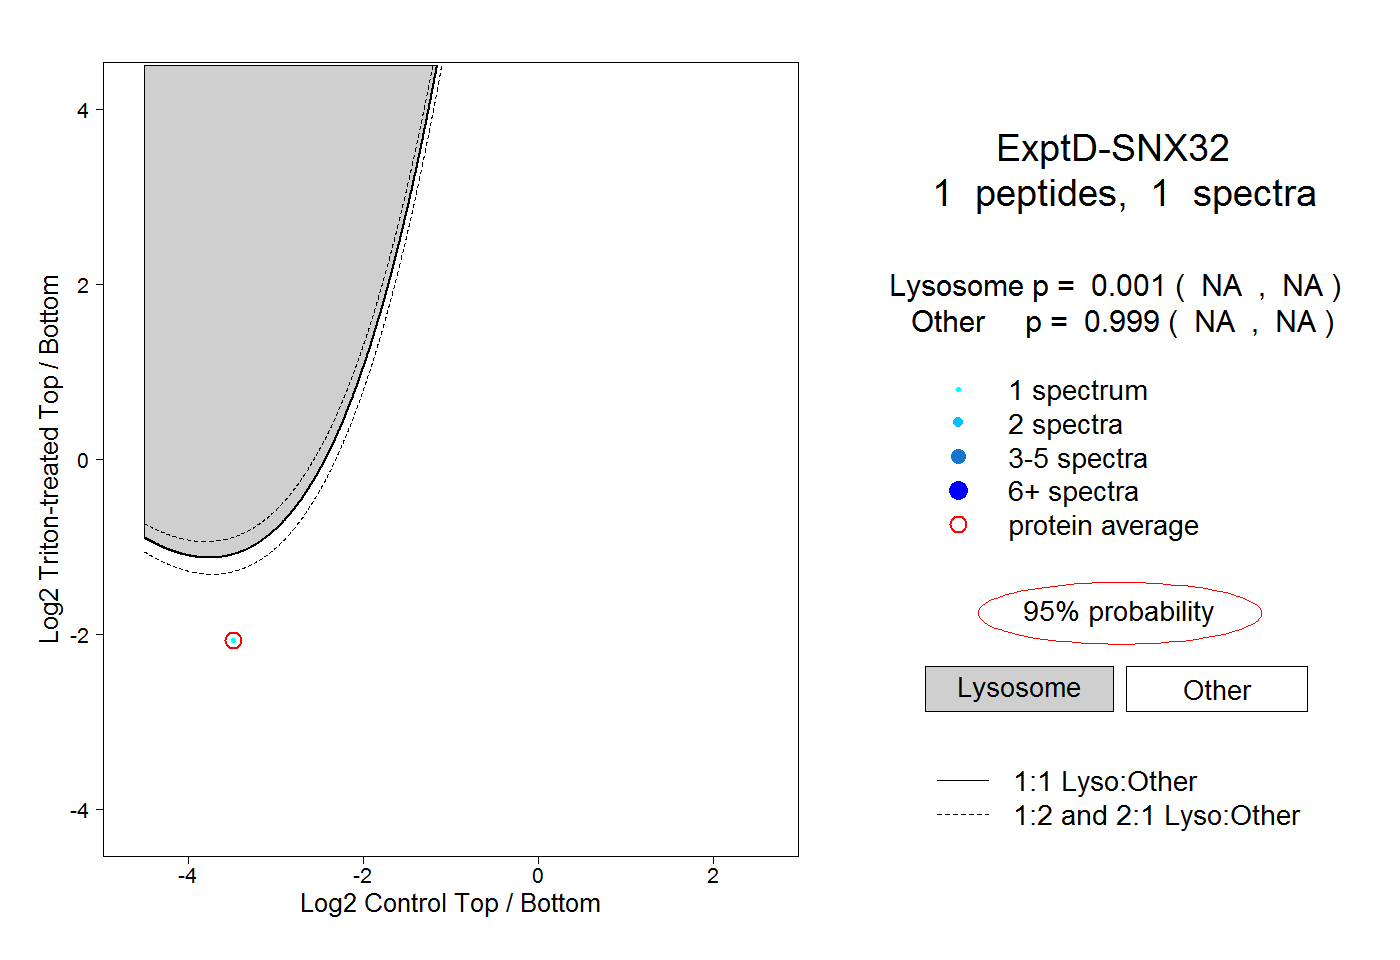
NA | NA
NA | NA