 6
6peptides
spectra
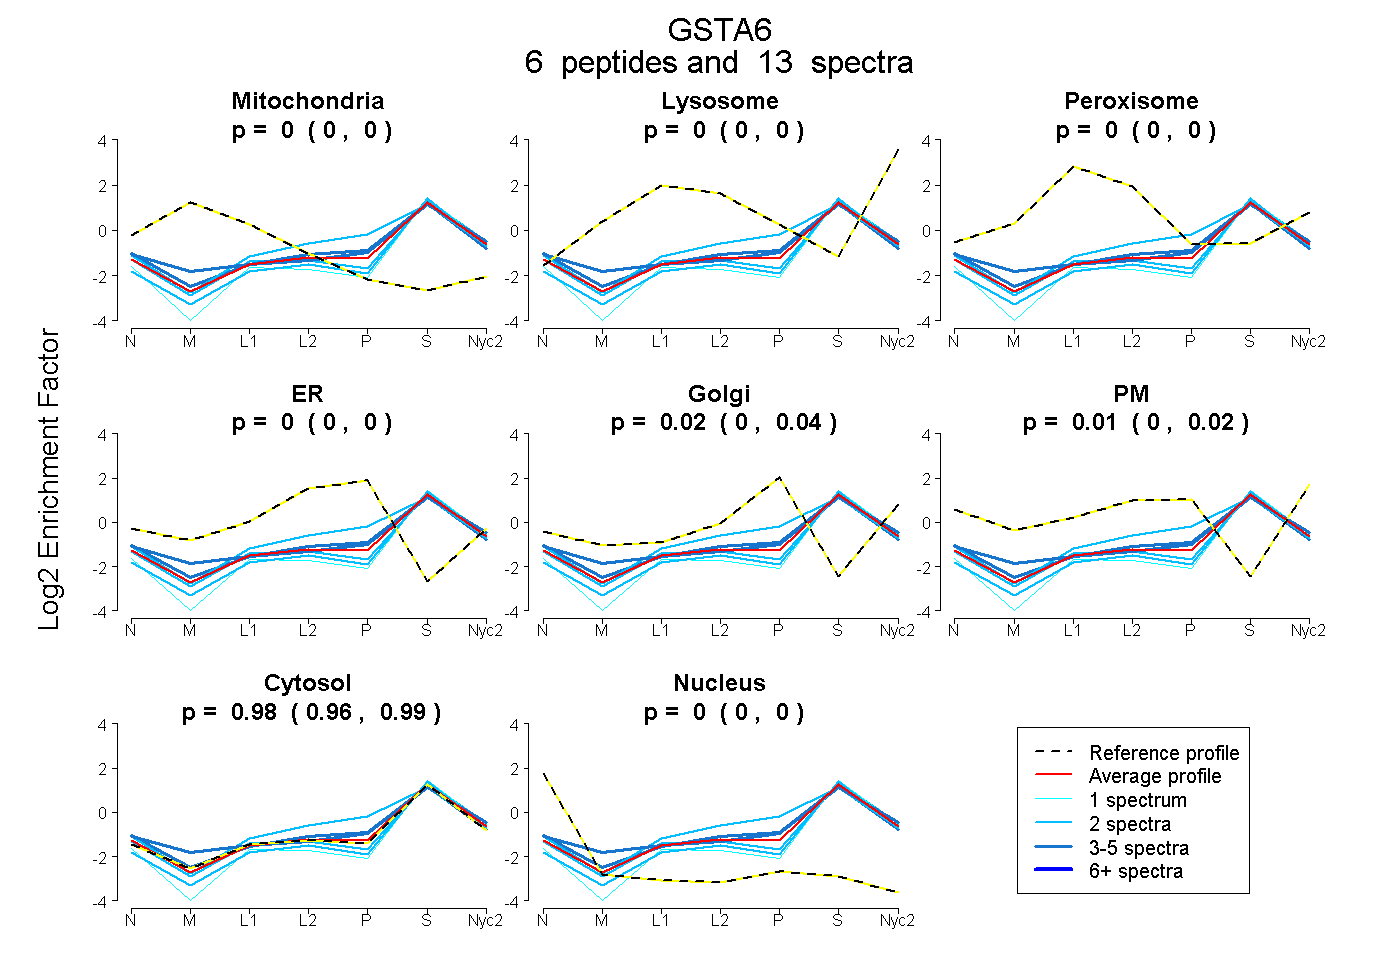
0.000 | 0.000
0.000 | 0.000
0.000 | 0.000
0.000 | 0.000
0.000 | 0.036
0.000 | 0.023
0.961 | 0.990
0.000 | 0.001
2peptides
spectra
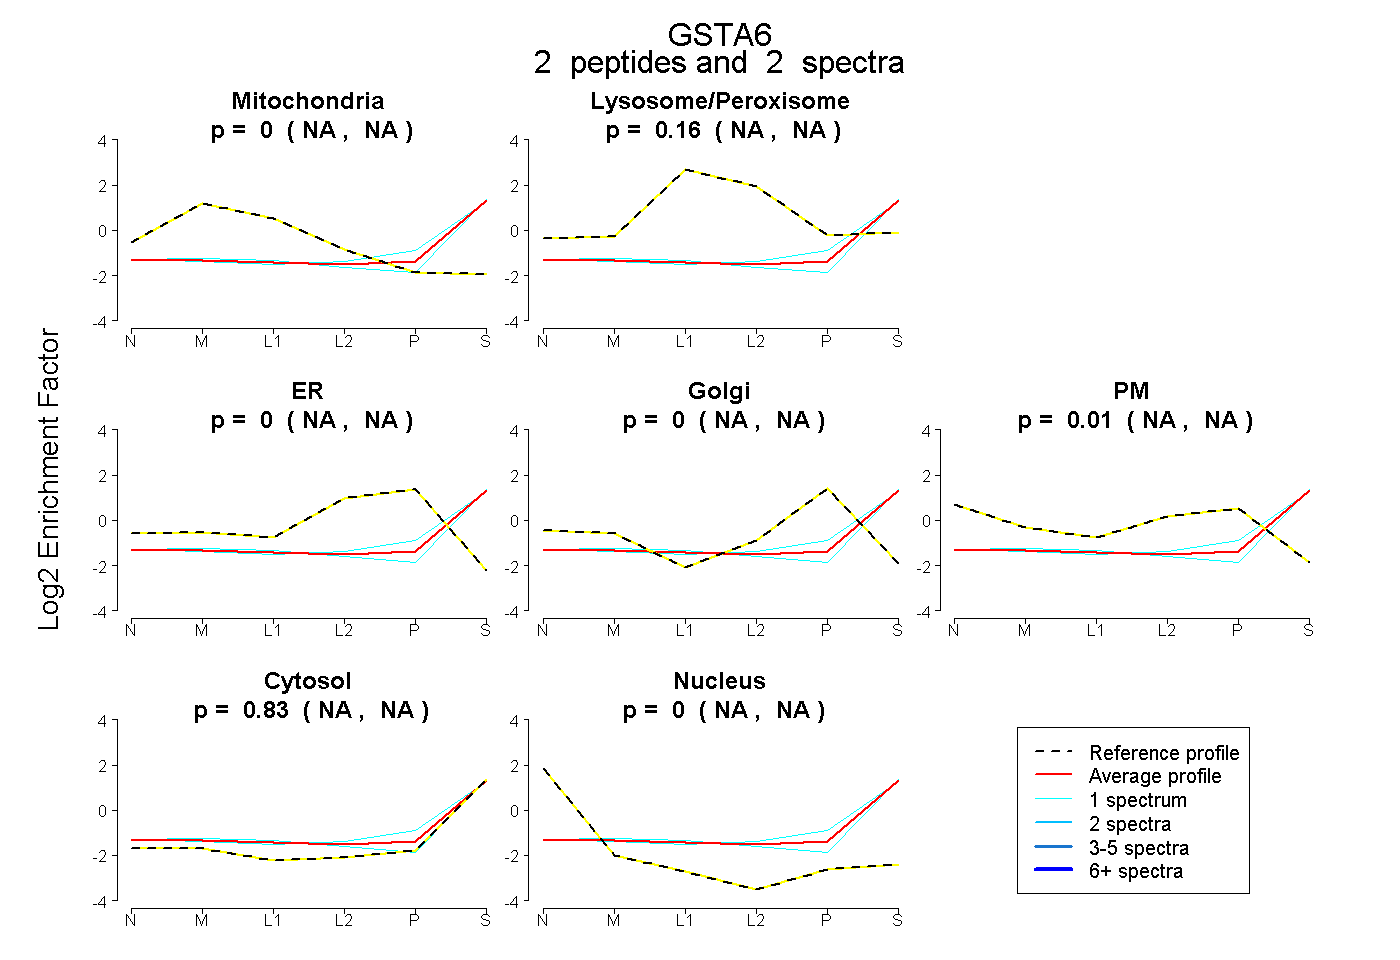
NA | NA
NA | NA
NA | NA
NA | NA
NA | NA
NA | NA
NA | NA
4peptides
spectra
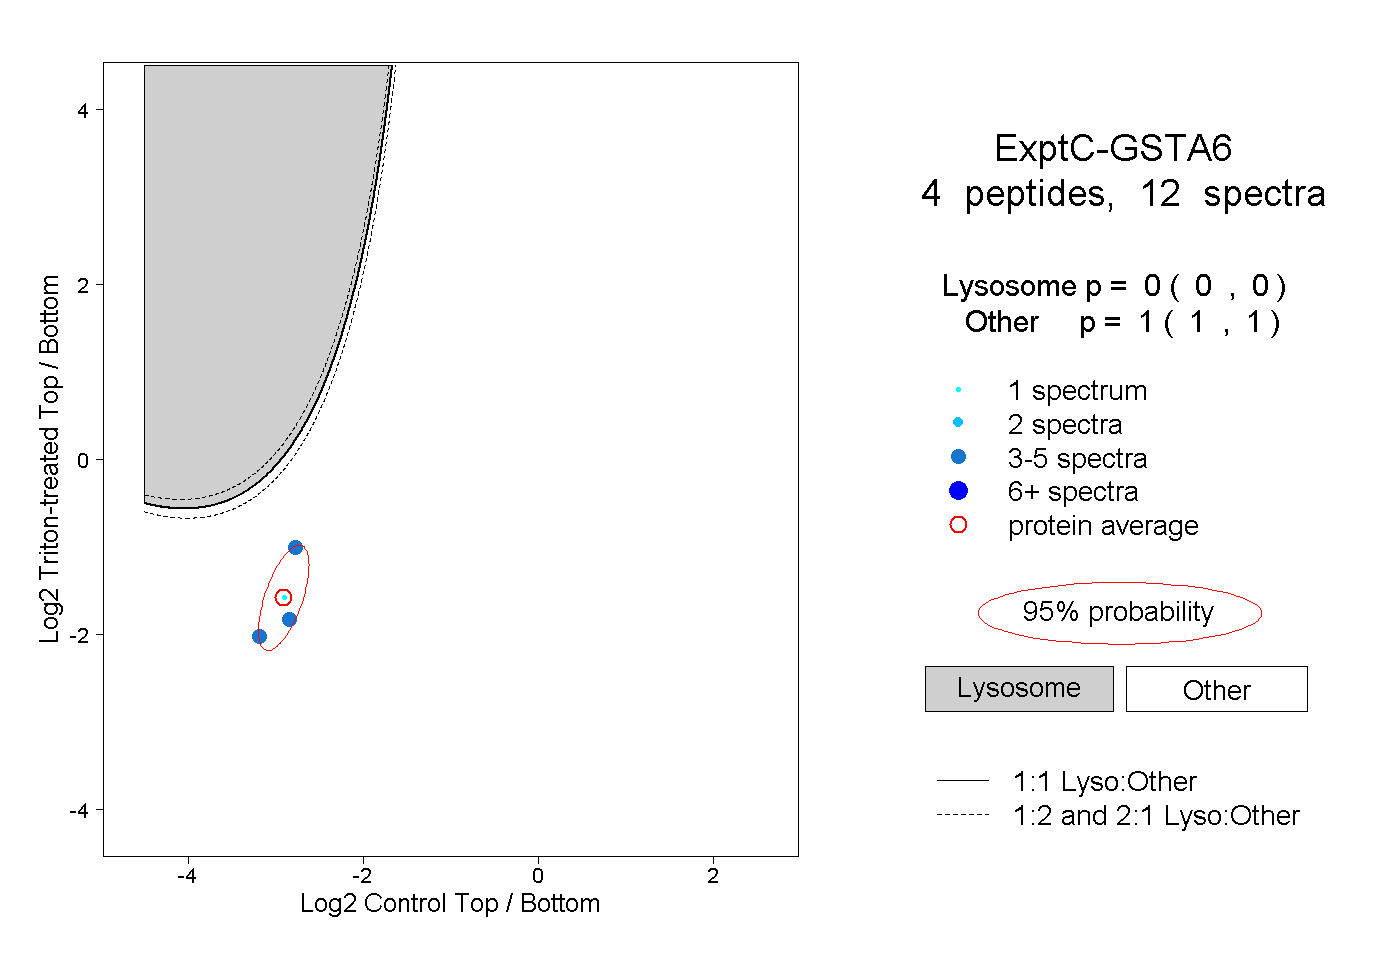
0.000 | 0.000
1.000 | 1.000