 5
5peptides
spectra
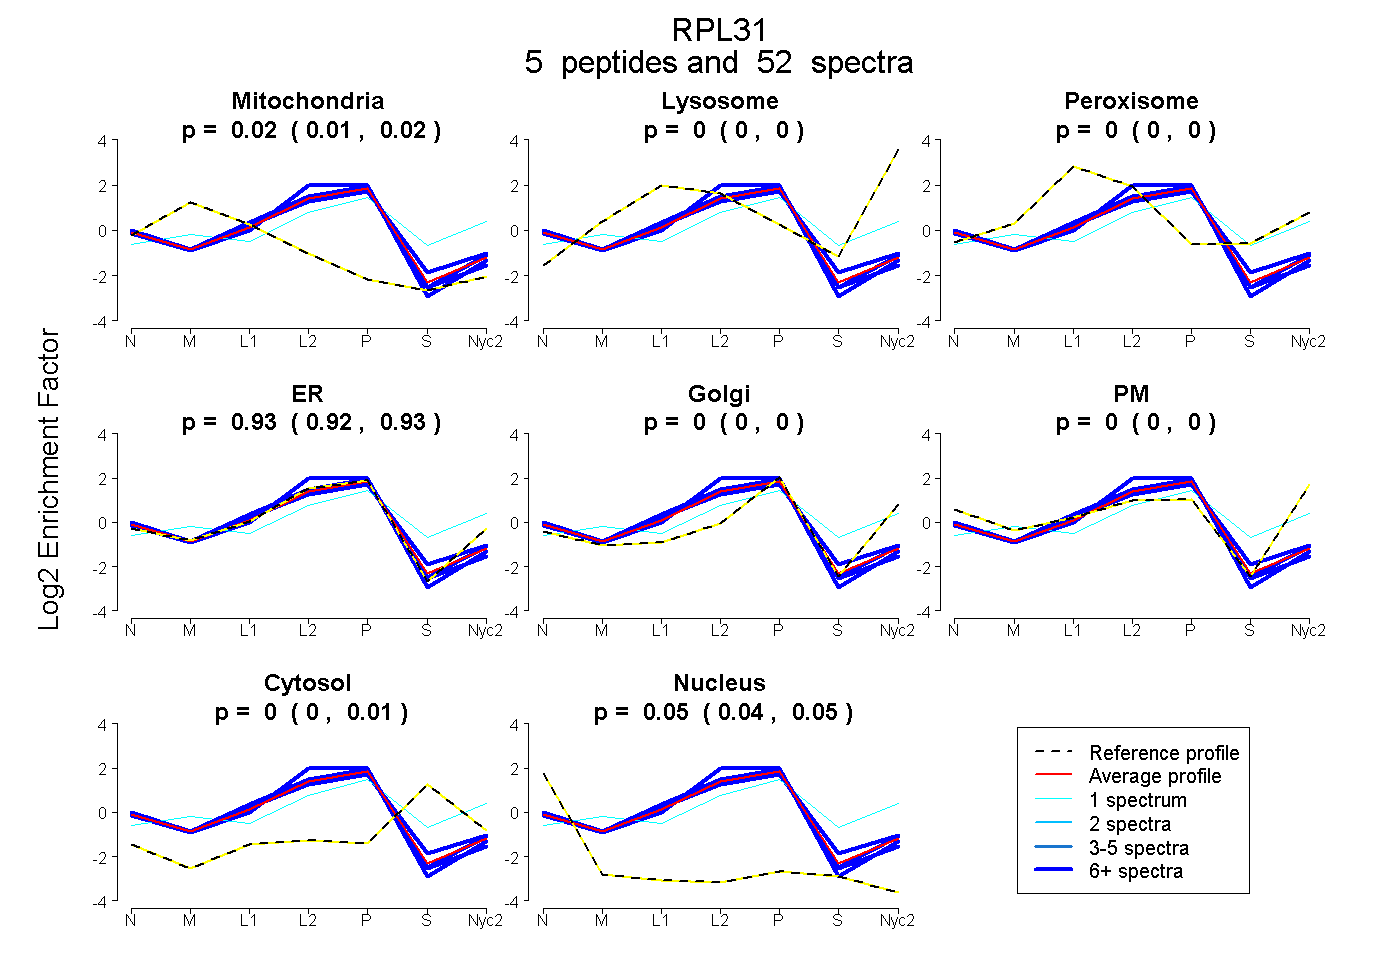
0.012 | 0.021
0.000 | 0.000
0.000 | 0.004
0.922 | 0.934
0.000 | 0.000
0.000 | 0.000
0.000 | 0.012
0.044 | 0.054
| Plot | Mito | Lyso | Perox | ER | Golgi | PM | Cytosol | Nucleus | |||||
| Expt A |
5 peptides |
52 spectra |
|
0.017 0.012 | 0.021 |
0.000 0.000 | 0.000 |
0.000 0.000 | 0.004 |
0.930 0.922 | 0.934 |
0.000 0.000 | 0.000 |
0.000 0.000 | 0.000 |
0.004 0.000 | 0.012 |
0.050 0.044 | 0.054 |
| 17 spectra, EMGTPDVR | 0.000 | 0.000 | 0.060 | 0.839 | 0.000 | 0.000 | 0.060 | 0.041 | ||
| 6 spectra, EYTINIHK | 0.017 | 0.000 | 0.000 | 0.941 | 0.000 | 0.000 | 0.000 | 0.042 | ||
| 6 spectra, LHGVGFK | 0.000 | 0.000 | 0.000 | 0.974 | 0.000 | 0.000 | 0.000 | 0.026 | ||
| 1 spectrum, NLQTVNVDEN | 0.000 | 0.129 | 0.071 | 0.308 | 0.300 | 0.000 | 0.192 | 0.000 | ||
| 22 spectra, SAINEVVTR | 0.030 | 0.000 | 0.000 | 0.928 | 0.000 | 0.000 | 0.000 | 0.042 |
| Plot | Lyso | Other | |||||||||||
| Expt D |
1 peptide |
4 spectra |
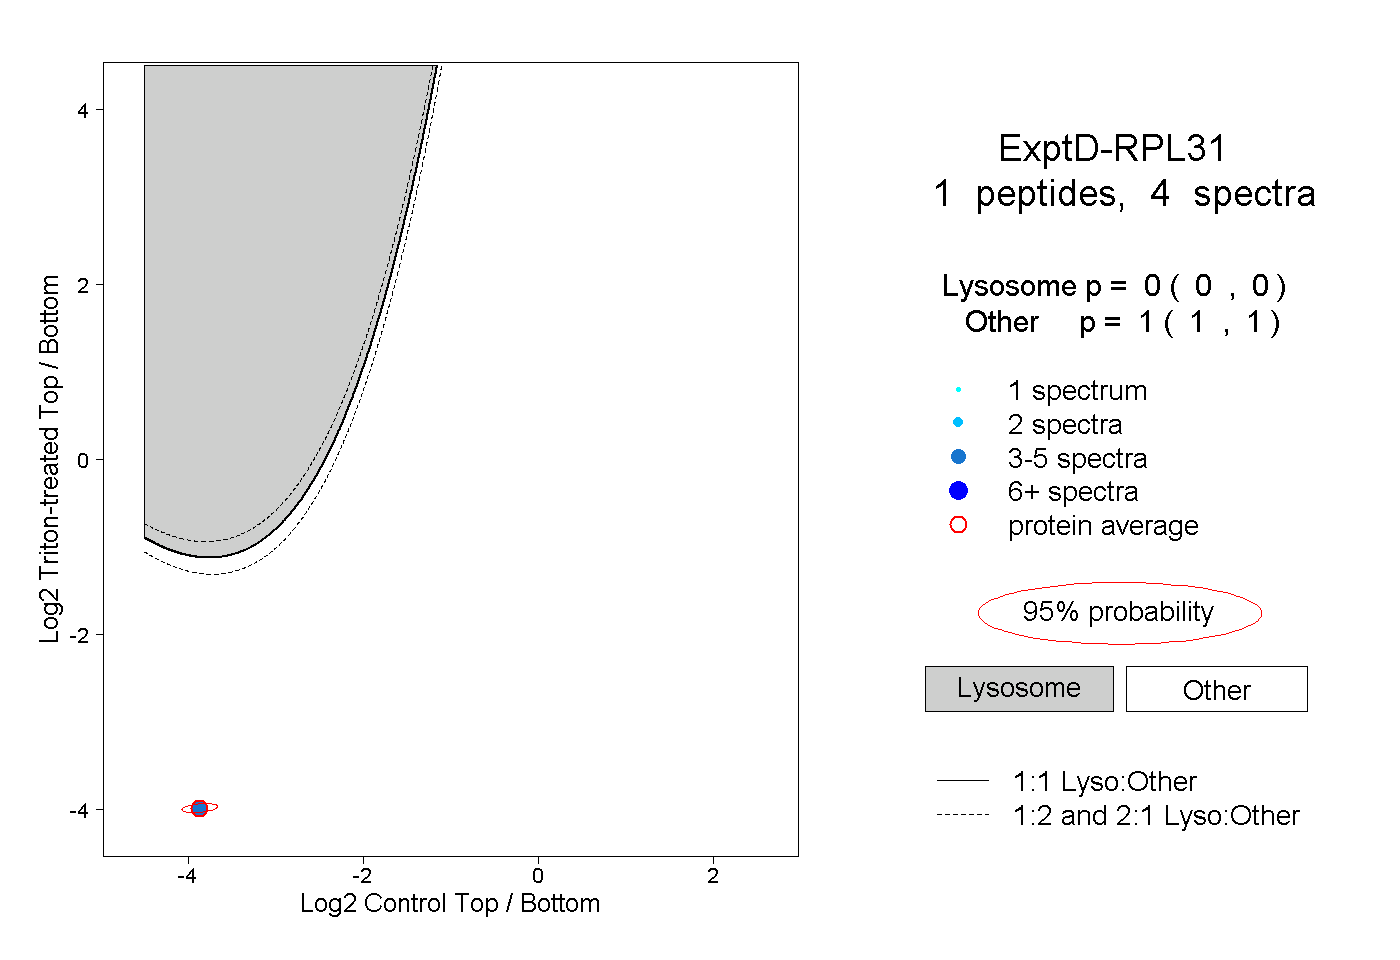 |
0.000 0.000 | 0.000 |
1.000 1.000 | 1.000 |