 2
2peptides
spectra
0.000 | 0.000
0.003 | 0.098
0.000 | 0.134
0.000 | 0.115
0.440 | 0.684
0.000 | 0.195
0.115 | 0.249
0.000 | 0.000
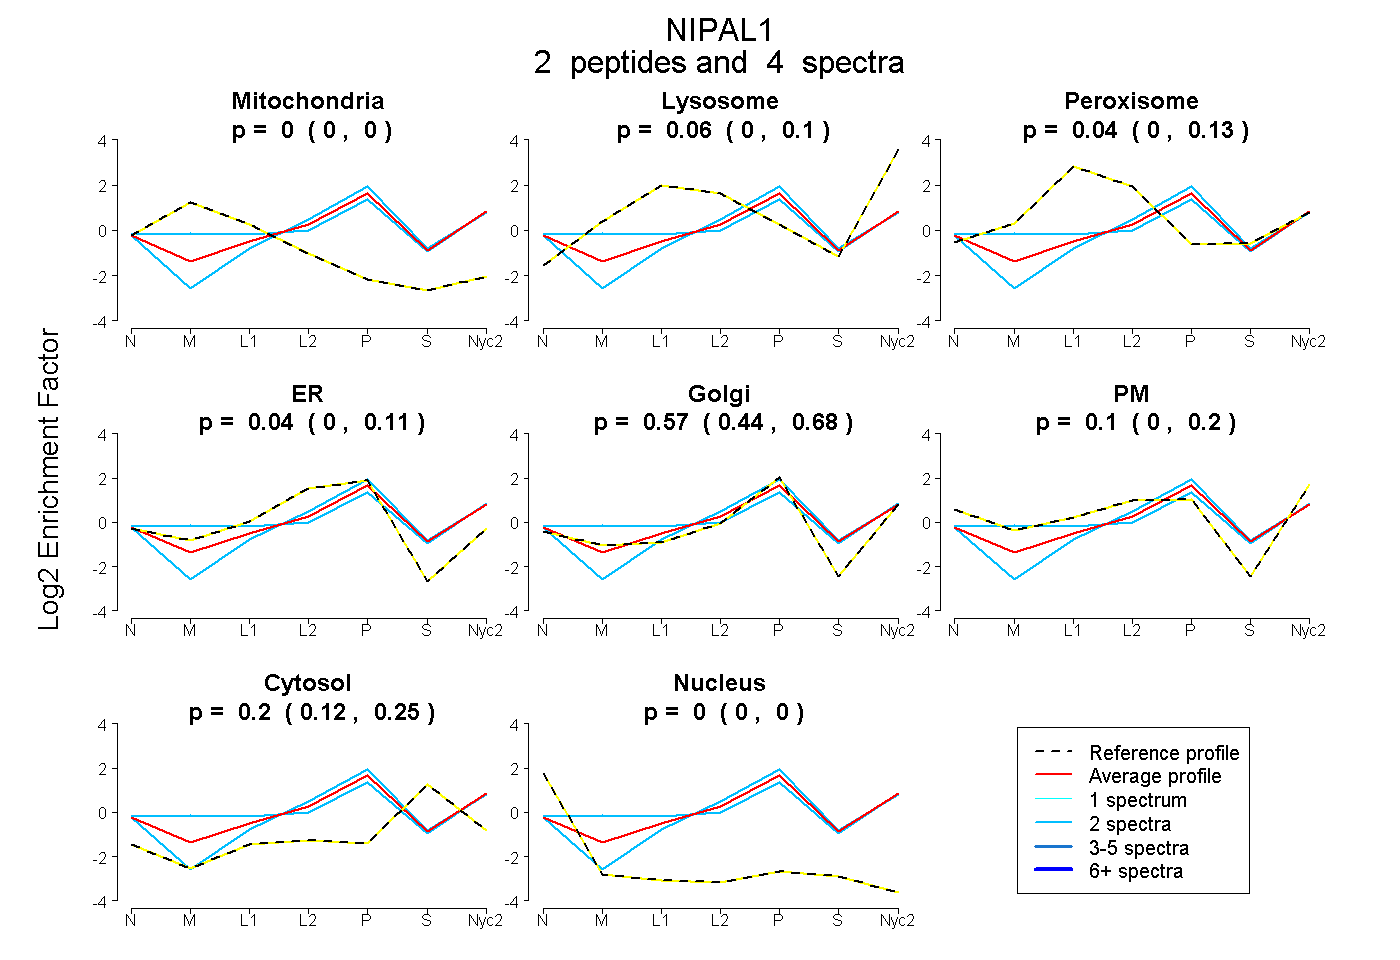
| Plot | Mito | Lyso | Perox | ER | Golgi | PM | Cytosol | Nucleus | |||||
| Expt A |
2 peptides |
4 spectra |
|
0.000 0.000 | 0.000 |
0.059 0.003 | 0.098 |
0.035 0.000 | 0.134 |
0.036 0.000 | 0.115 |
0.568 0.440 | 0.684 |
0.104 0.000 | 0.195 |
0.198 0.115 | 0.249 |
0.000 0.000 | 0.000 |
| 2 spectra, NTNITWSELTSTAK | 0.001 | 0.057 | 0.172 | 0.000 | 0.567 | 0.078 | 0.124 | 0.000 | ||
| 2 spectra, GLLQLADK | 0.000 | 0.012 | 0.000 | 0.129 | 0.620 | 0.000 | 0.239 | 0.000 |