15
15peptides
spectra
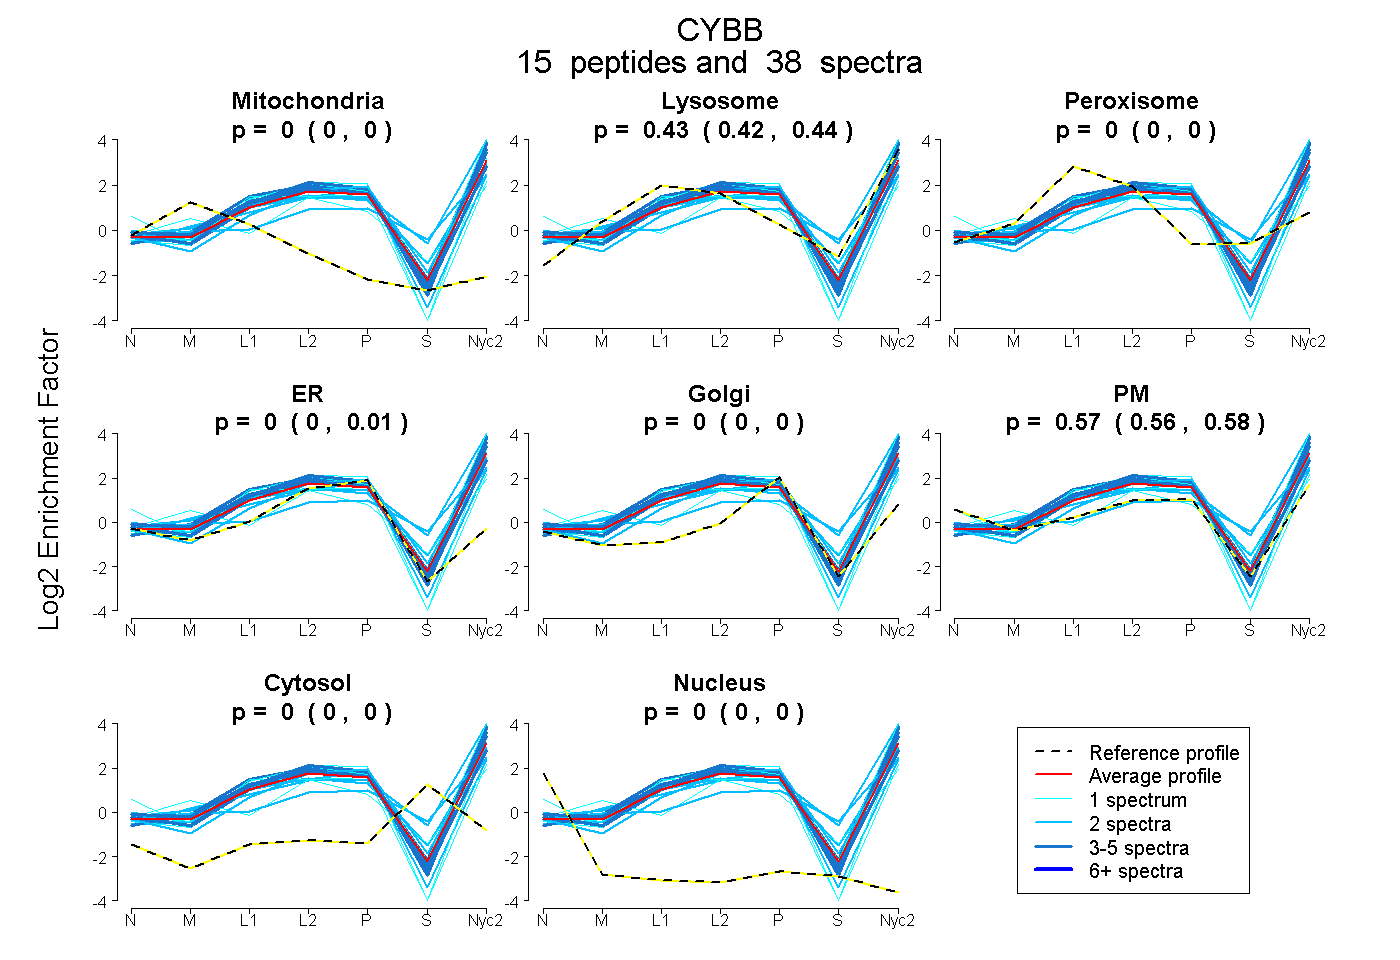
0.000 | 0.000
0.420 | 0.441
0.000 | 0.000
0.000 | 0.005
0.000 | 0.000
0.557 | 0.578
0.000 | 0.000
0.000 | 0.000
5peptides
spectra
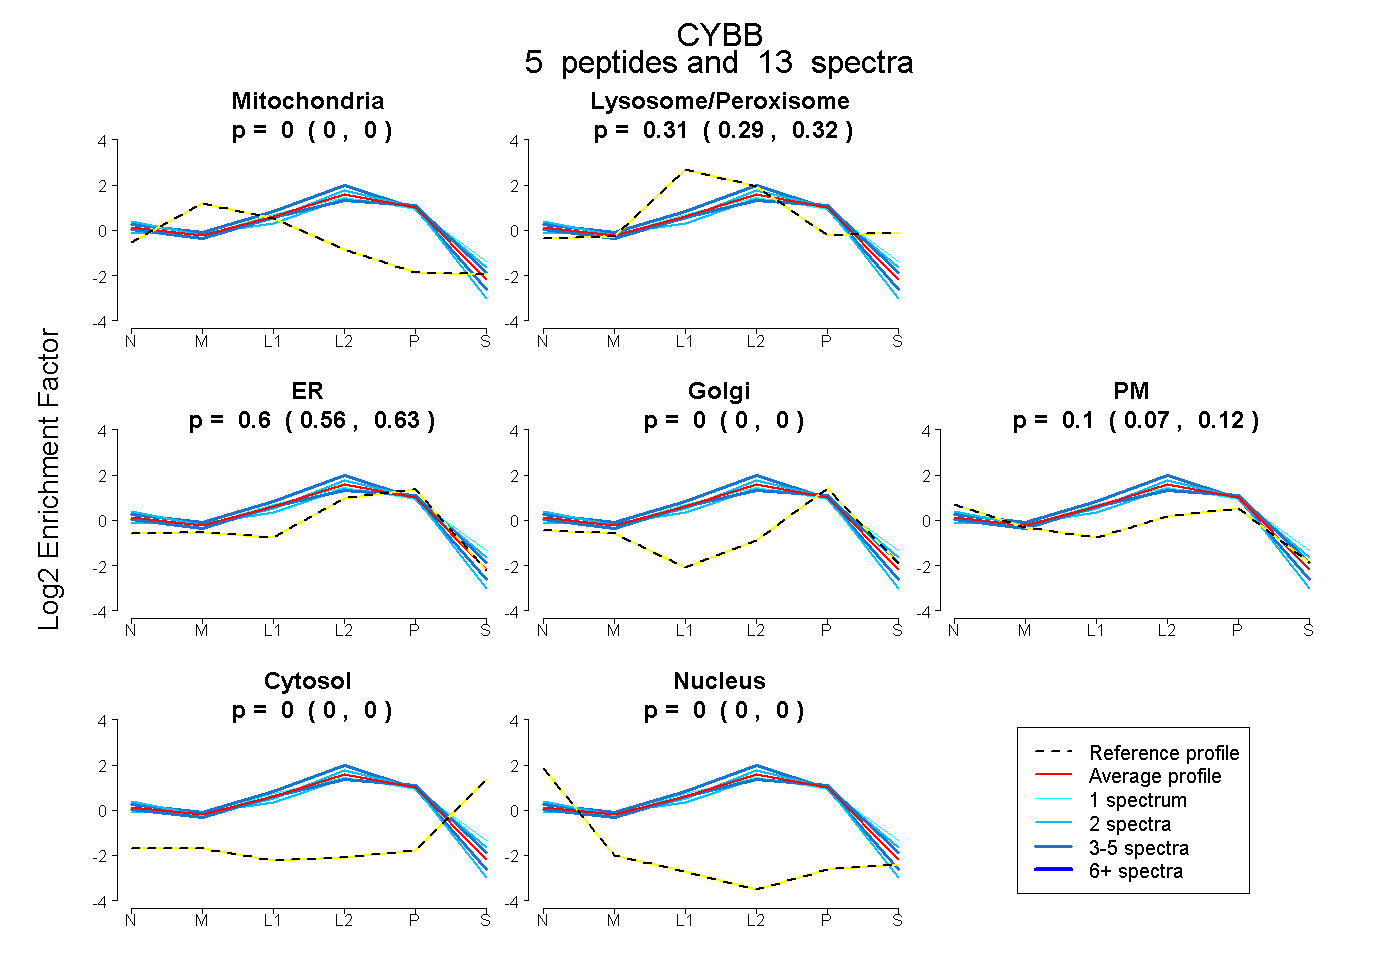
0.000 | 0.000
0.287 | 0.321
0.562 | 0.628
0.000 | 0.000
0.067 | 0.122
0.000 | 0.000
0.000 | 0.000