 15
15peptides
spectra
0.000 | 0.000
0.420 | 0.441
0.000 | 0.000
0.000 | 0.005
0.000 | 0.000
0.557 | 0.578
0.000 | 0.000
0.000 | 0.000
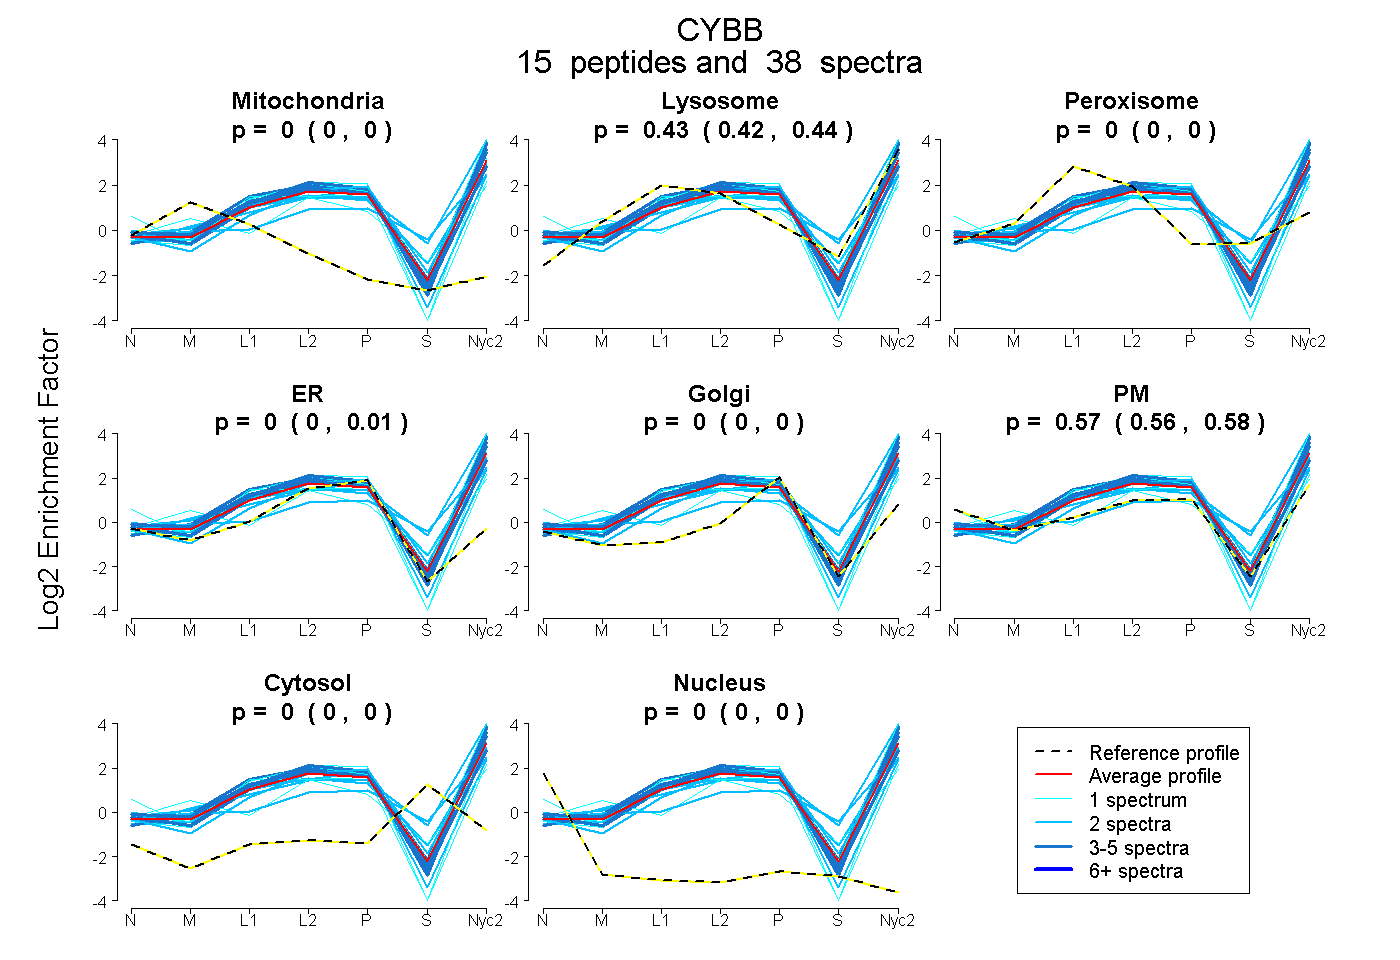
| Plot | Mito | Lyso | Perox | ER | Golgi | PM | Cytosol | Nucleus | |||||
| Expt A |
15 peptides |
38 spectra |
|
0.000 0.000 | 0.000 |
0.431 0.420 | 0.441 |
0.000 0.000 | 0.000 |
0.000 0.000 | 0.005 |
0.000 0.000 | 0.000 |
0.569 0.557 | 0.578 |
0.000 0.000 | 0.000 |
0.000 0.000 | 0.000 |
| 4 spectra, FAGNPPMTWK | 0.000 | 0.489 | 0.000 | 0.000 | 0.000 | 0.511 | 0.000 | 0.000 | ||
| 1 spectrum, IGVFLCGPEALAK | 0.000 | 0.283 | 0.000 | 0.432 | 0.000 | 0.285 | 0.000 | 0.000 | ||
| 2 spectra, CPQVSK | 0.000 | 0.469 | 0.000 | 0.092 | 0.000 | 0.439 | 0.000 | 0.000 | ||
| 2 spectra, VVTHPFK | 0.000 | 0.407 | 0.000 | 0.031 | 0.190 | 0.372 | 0.000 | 0.000 | ||
| 1 spectrum, MEVGQYIFVK | 0.000 | 0.183 | 0.000 | 0.000 | 0.000 | 0.817 | 0.000 | 0.000 | ||
| 5 spectra, LLGSALALAR | 0.000 | 0.593 | 0.000 | 0.000 | 0.000 | 0.407 | 0.000 | 0.000 | ||
| 4 spectra, NLLSFLR | 0.000 | 0.520 | 0.000 | 0.000 | 0.000 | 0.480 | 0.000 | 0.000 | ||
| 2 spectra, ENEEYLNFAR | 0.000 | 0.756 | 0.000 | 0.000 | 0.119 | 0.125 | 0.000 | 0.000 | ||
| 2 spectra, GSSACCSTR | 0.000 | 0.208 | 0.000 | 0.130 | 0.000 | 0.663 | 0.000 | 0.000 | ||
| 4 spectra, YCDNATSLR | 0.000 | 0.383 | 0.000 | 0.050 | 0.000 | 0.566 | 0.000 | 0.000 | ||
| 1 spectrum, NPEGGLYVAVTR | 0.000 | 0.585 | 0.000 | 0.000 | 0.000 | 0.415 | 0.000 | 0.000 | ||
| 5 spectra, QSISNSESGPR | 0.000 | 0.449 | 0.000 | 0.000 | 0.000 | 0.551 | 0.000 | 0.000 | ||
| 1 spectrum, IVGDWTEGLFNACGCDK | 0.012 | 0.302 | 0.000 | 0.066 | 0.000 | 0.561 | 0.060 | 0.000 | ||
| 2 spectra, QEFQDAWK | 0.000 | 0.459 | 0.000 | 0.000 | 0.101 | 0.301 | 0.138 | 0.000 | ||
| 2 spectra, GVHFIFNK | 0.000 | 0.542 | 0.000 | 0.000 | 0.154 | 0.304 | 0.000 | 0.000 |
| Plot | Mito | Lyso or Perox | ER | Golgi | PM | Cytosol | Nucleus | ||||||
| Expt B |
5 peptides |
13 spectra |
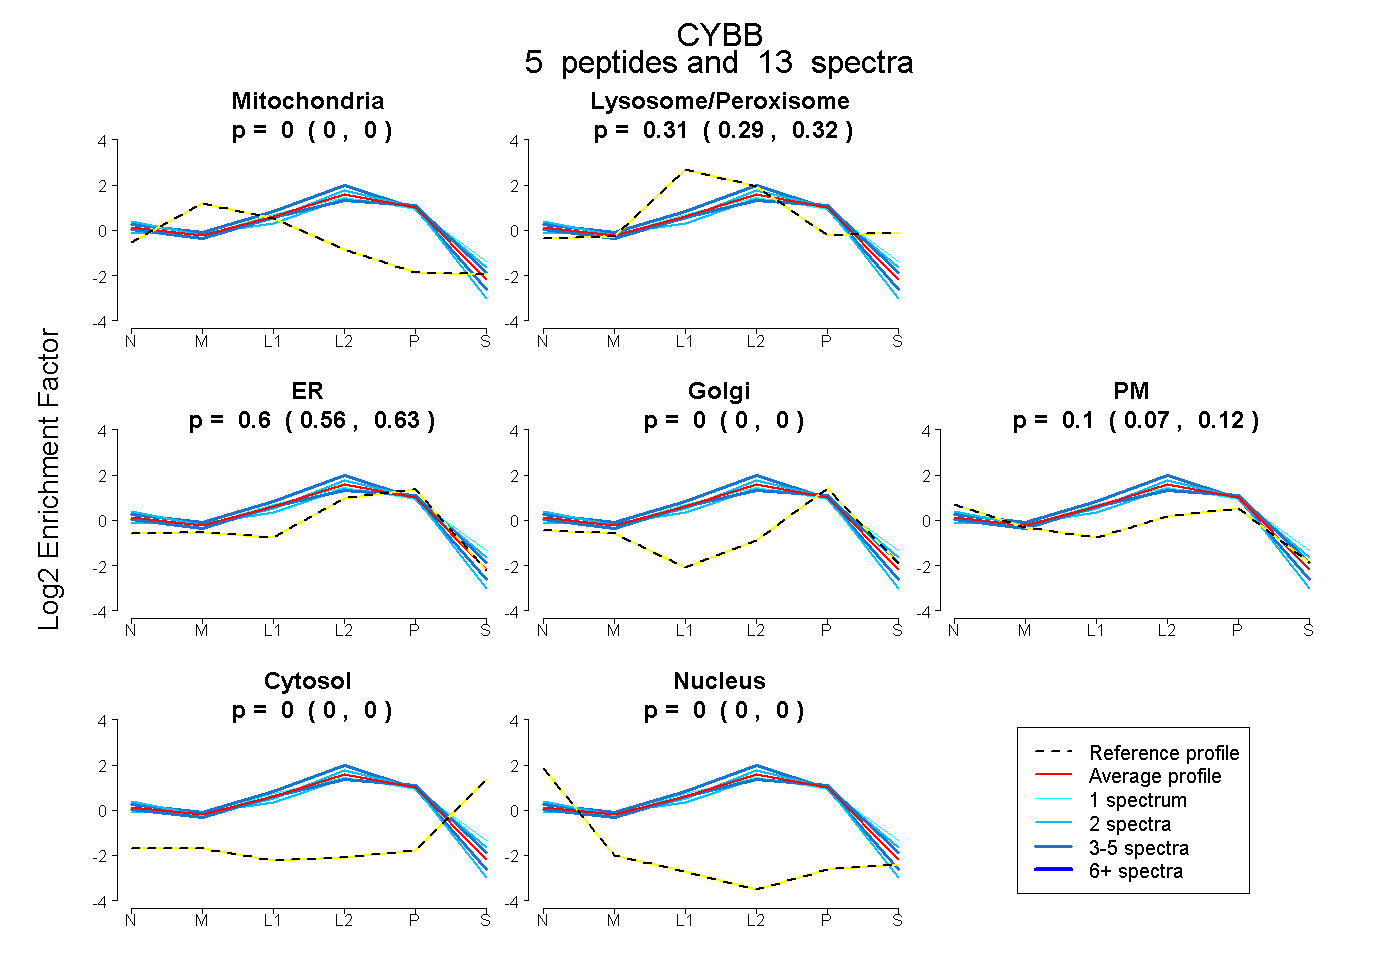 |
0.000 0.000 | 0.000 |
0.305 0.287 | 0.321 |
0.598 0.562 | 0.628 |
0.000 0.000 | 0.000 |
0.097 0.067 | 0.122 |
0.000 0.000 | 0.000 |
0.000 0.000 | 0.000 |
|||
| Plot | Lyso | Other | |||||||||||
| Expt C |
20 peptides |
105 spectra |
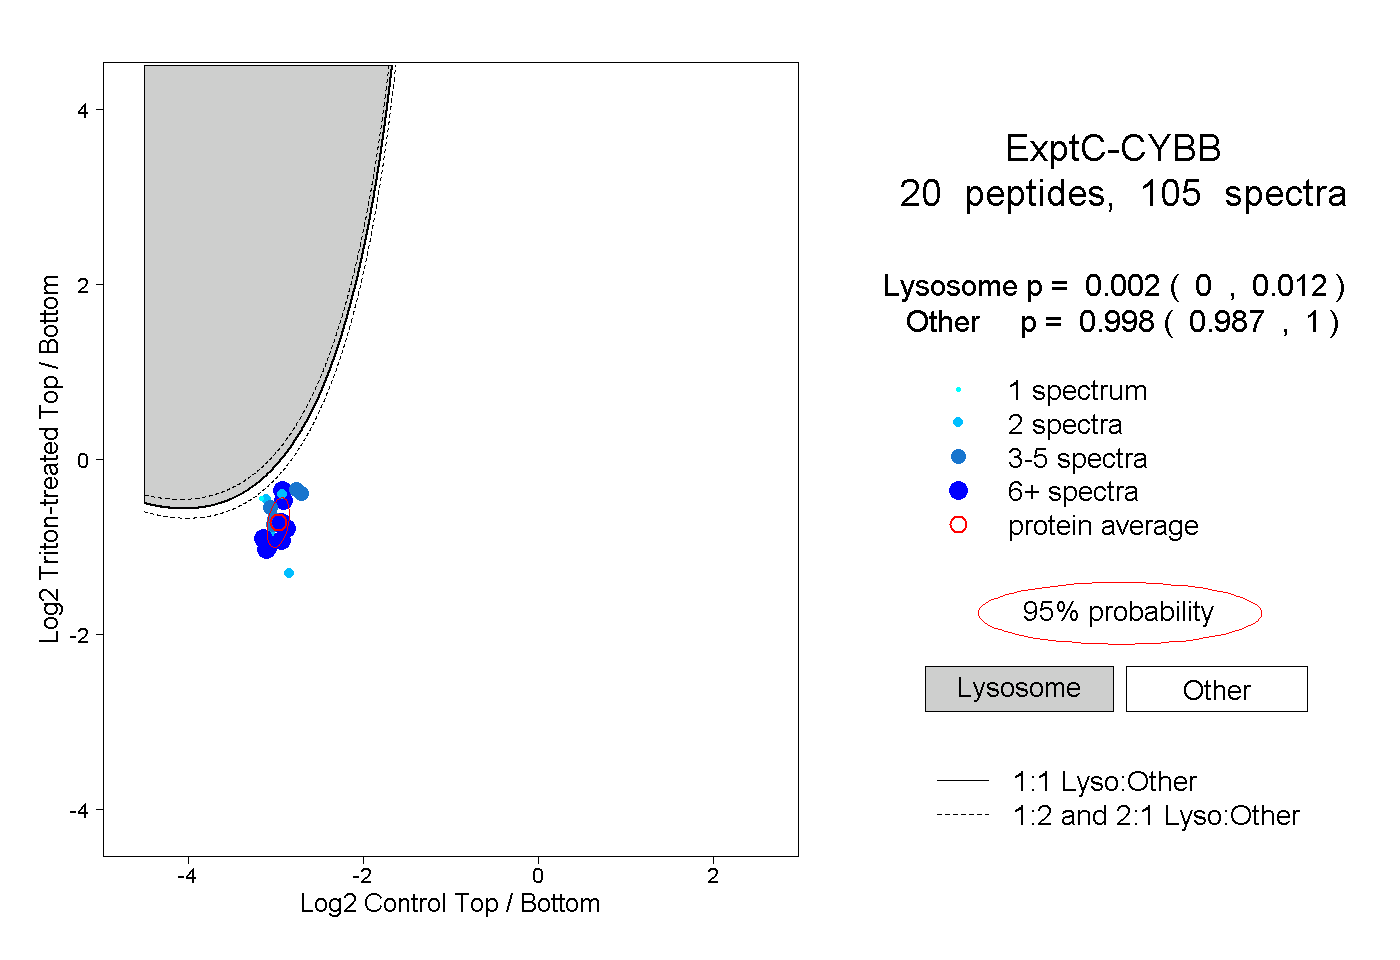 |
0.002 0.000 | 0.012 |
0.998 0.987 | 1.000 |
||||||||
| Plot | Lyso | Other | |||||||||||
| Expt D |
8 peptides |
11 spectra |
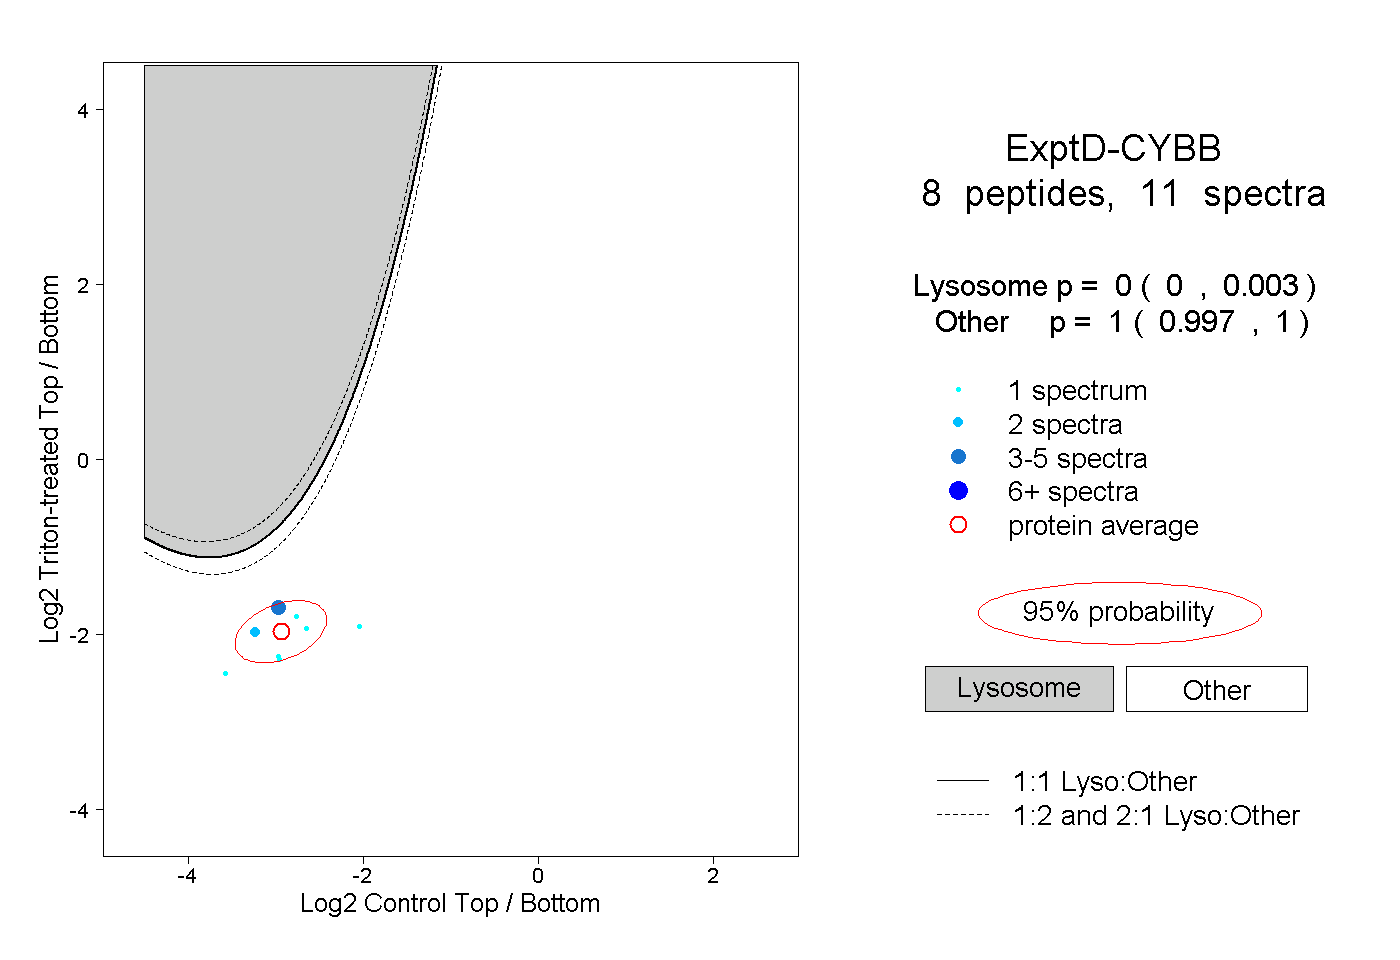 |
0.000 0.000 | 0.003 |
1.000 0.997 | 1.000 |