 4
4peptides
spectra
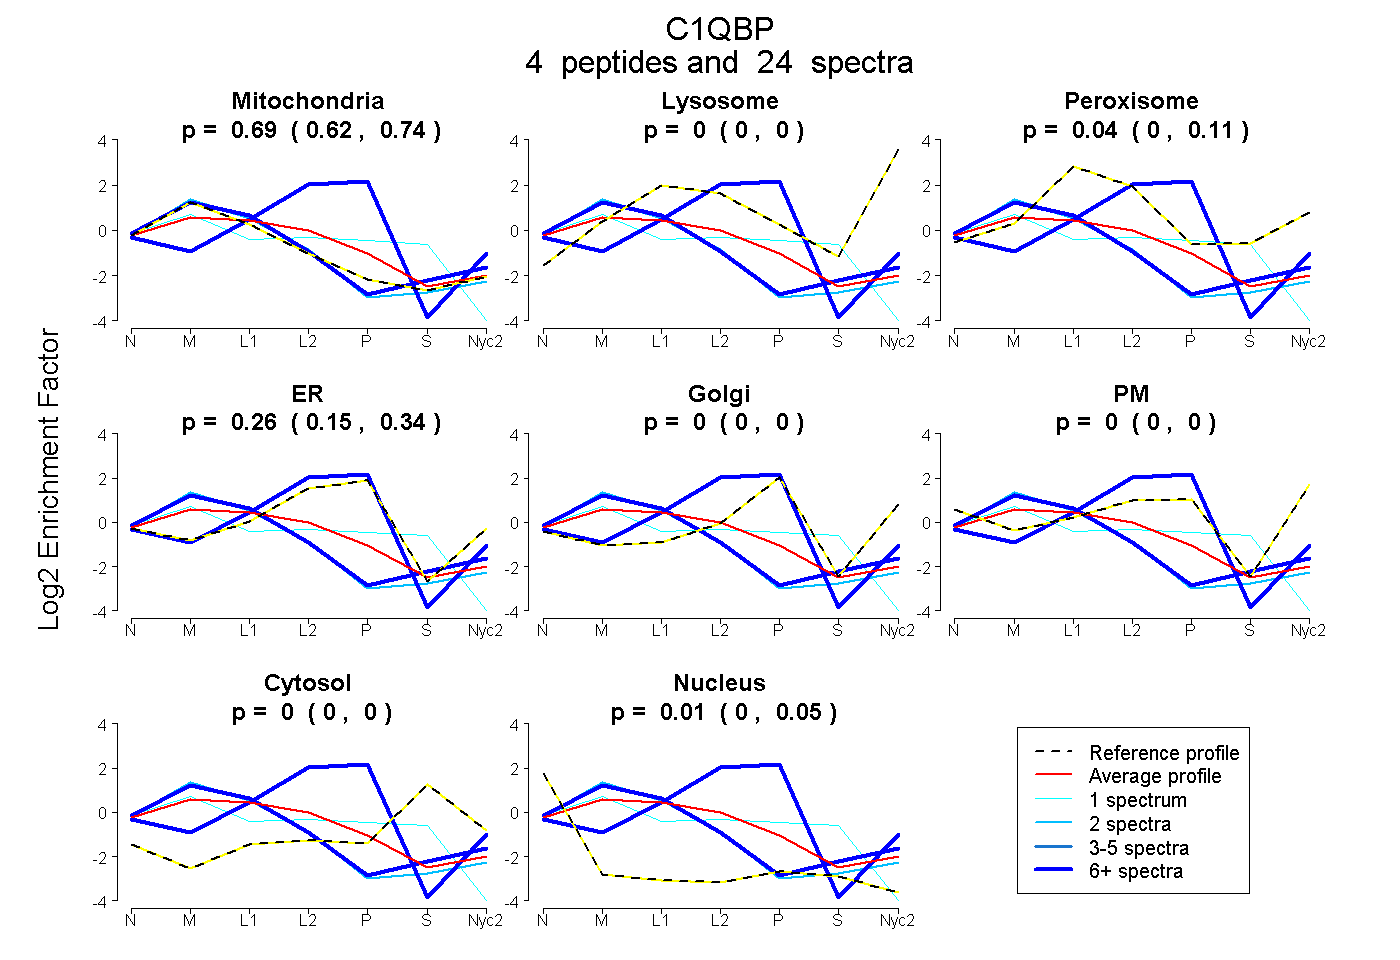
0.619 | 0.742
0.000 | 0.000
0.000 | 0.111
0.147 | 0.336
0.000 | 0.000
0.000 | 0.000
0.000 | 0.000
0.000 | 0.048
3peptides
spectra
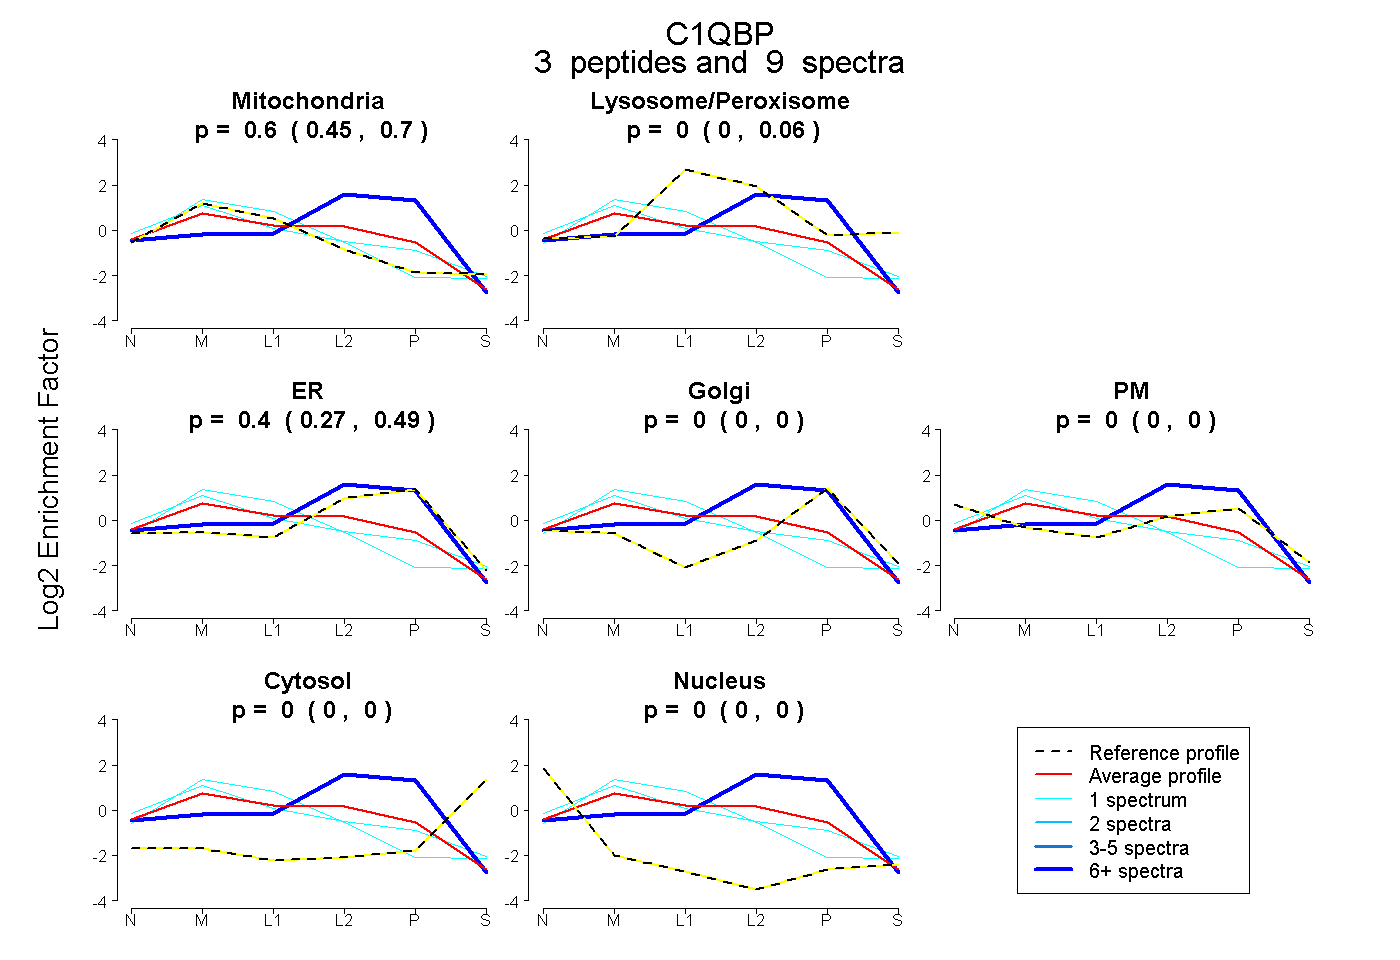
0.450 | 0.695
0.000 | 0.057
0.265 | 0.495
0.000 | 0.000
0.000 | 0.000
0.000 | 0.000
0.000 | 0.000
5peptides
spectra
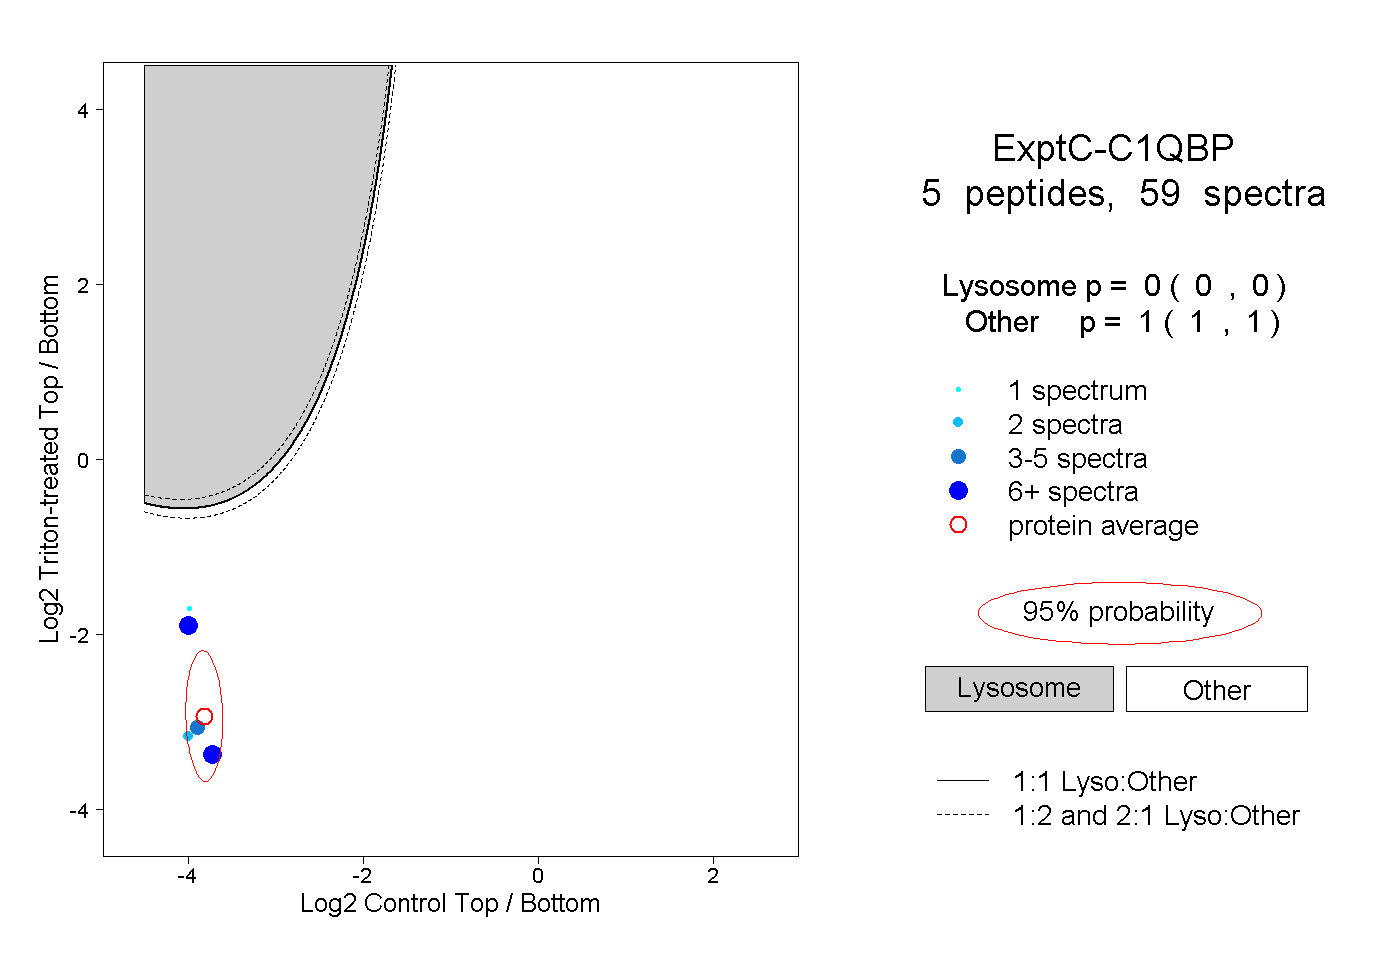
0.000 | 0.000
1.000 | 1.000
2peptides
spectra
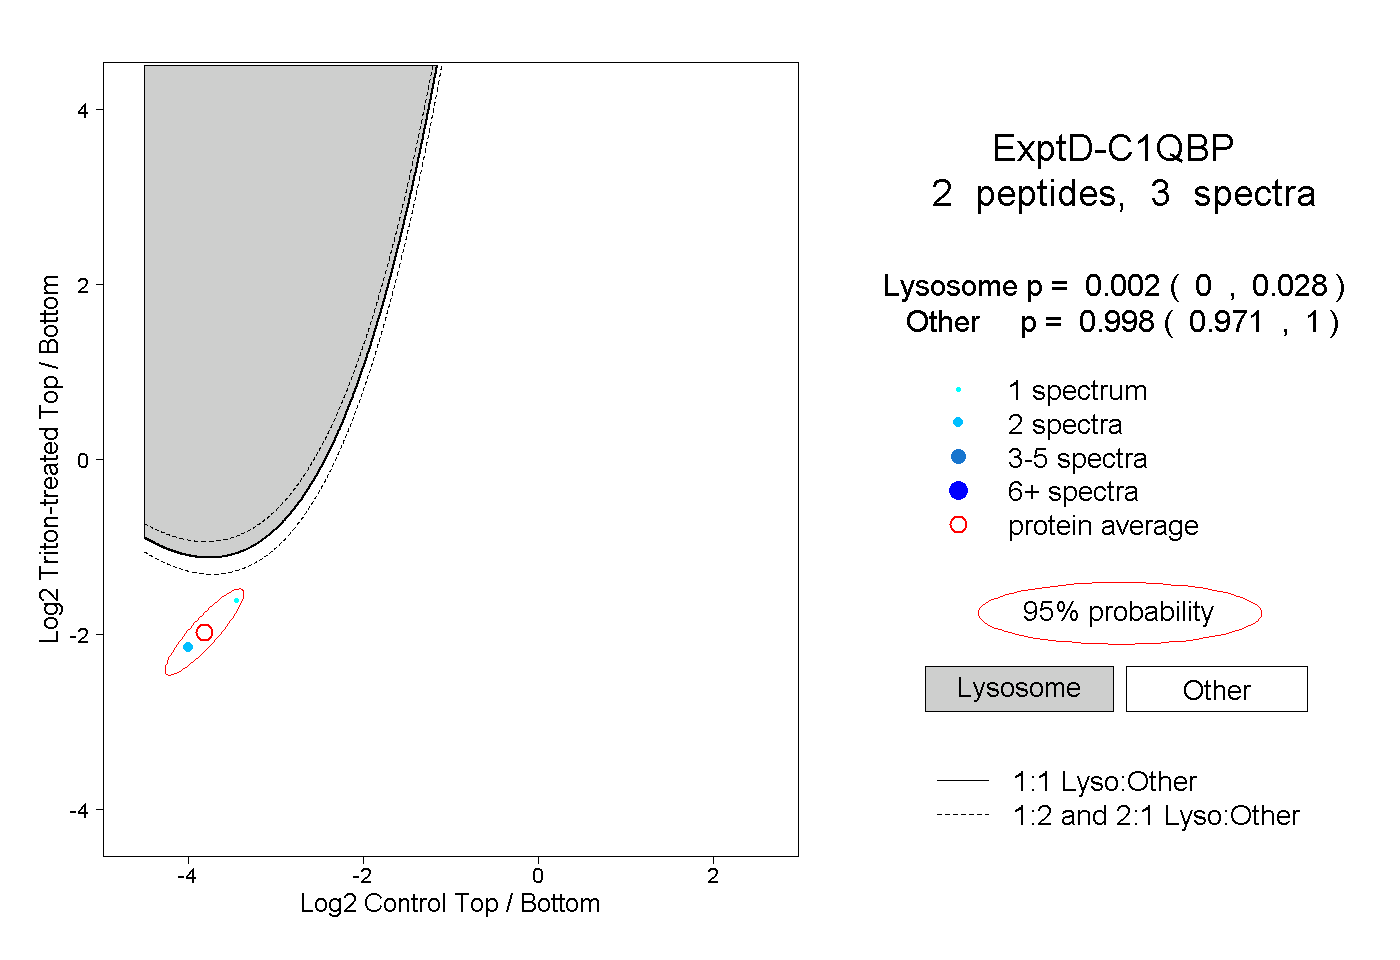
0.000 | 0.028
0.971 | 1.000