 6
6peptides
spectra
0.643 | 0.662
0.007 | 0.059
0.027 | 0.080
0.000 | 0.000
0.000 | 0.000
0.243 | 0.267
0.000 | 0.000
0.000 | 0.000
| Plot | Mito | Lyso | Perox | ER | Golgi | PM | Cytosol | Nucleus | |||||
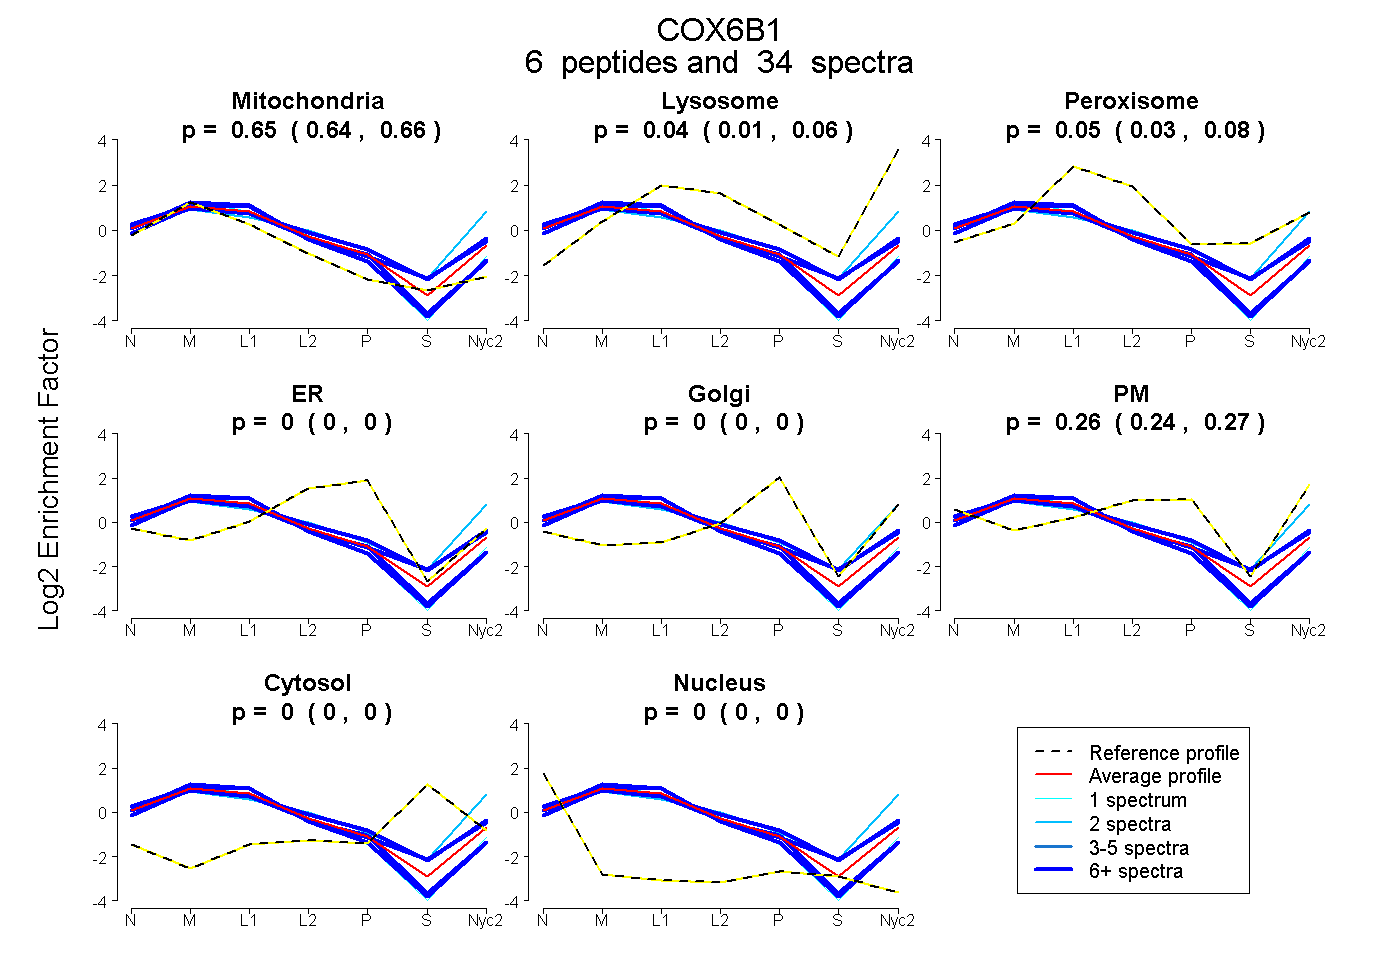
| Expt A |
6 peptides |
34 spectra |
|
0.653 0.643 | 0.662 |
0.036 0.007 | 0.059 |
0.055 0.027 | 0.080 |
0.000 0.000 | 0.000 |
0.000 0.000 | 0.000 |
0.256 0.243 | 0.267 |
0.000 0.000 | 0.000 |
0.000 0.000 | 0.000 |
| 7 spectra, NCWQNYLDFHR | 0.640 | 0.128 | 0.079 | 0.000 | 0.000 | 0.153 | 0.000 | 0.000 | ||
| 12 spectra, TAPFDSR | 0.550 | 0.031 | 0.136 | 0.000 | 0.000 | 0.283 | 0.000 | 0.000 | ||
| 1 spectrum, FPNQNQTK | 0.772 | 0.000 | 0.000 | 0.010 | 0.000 | 0.218 | 0.000 | 0.000 | ||
| 6 spectra, GGDVSVCEWYR | 0.746 | 0.000 | 0.000 | 0.096 | 0.000 | 0.158 | 0.000 | 0.000 | ||
| 2 spectra, IAEGTFPGK | 0.465 | 0.255 | 0.000 | 0.000 | 0.000 | 0.280 | 0.000 | 0.000 | ||
| 6 spectra, SLCPVSWVSAWDDR | 0.792 | 0.000 | 0.000 | 0.040 | 0.000 | 0.167 | 0.000 | 0.000 |
| Plot | Mito | Lyso or Perox | ER | Golgi | PM | Cytosol | Nucleus | ||||||
| Expt B |
3 peptides |
8 spectra |
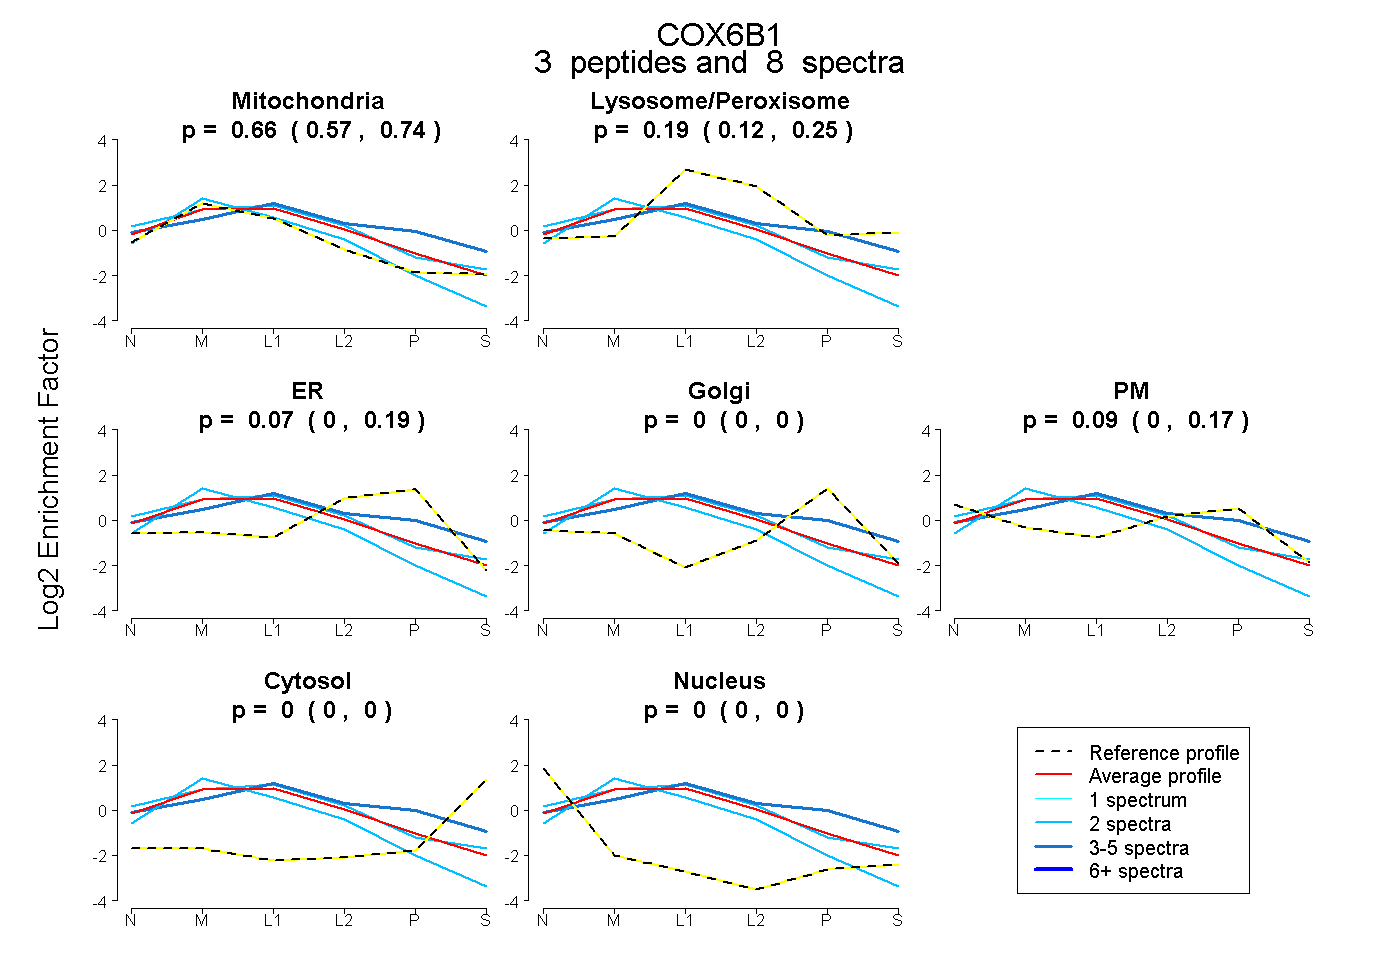 |
0.659 0.566 | 0.737 |
0.189 0.117 | 0.247 |
0.065 0.000 | 0.186 |
0.000 0.000 | 0.000 |
0.087 0.000 | 0.167 |
0.000 0.000 | 0.000 |
0.000 0.000 | 0.000 |
|||
| Plot | Lyso | Other | |||||||||||
| Expt C |
6 peptides |
191 spectra |
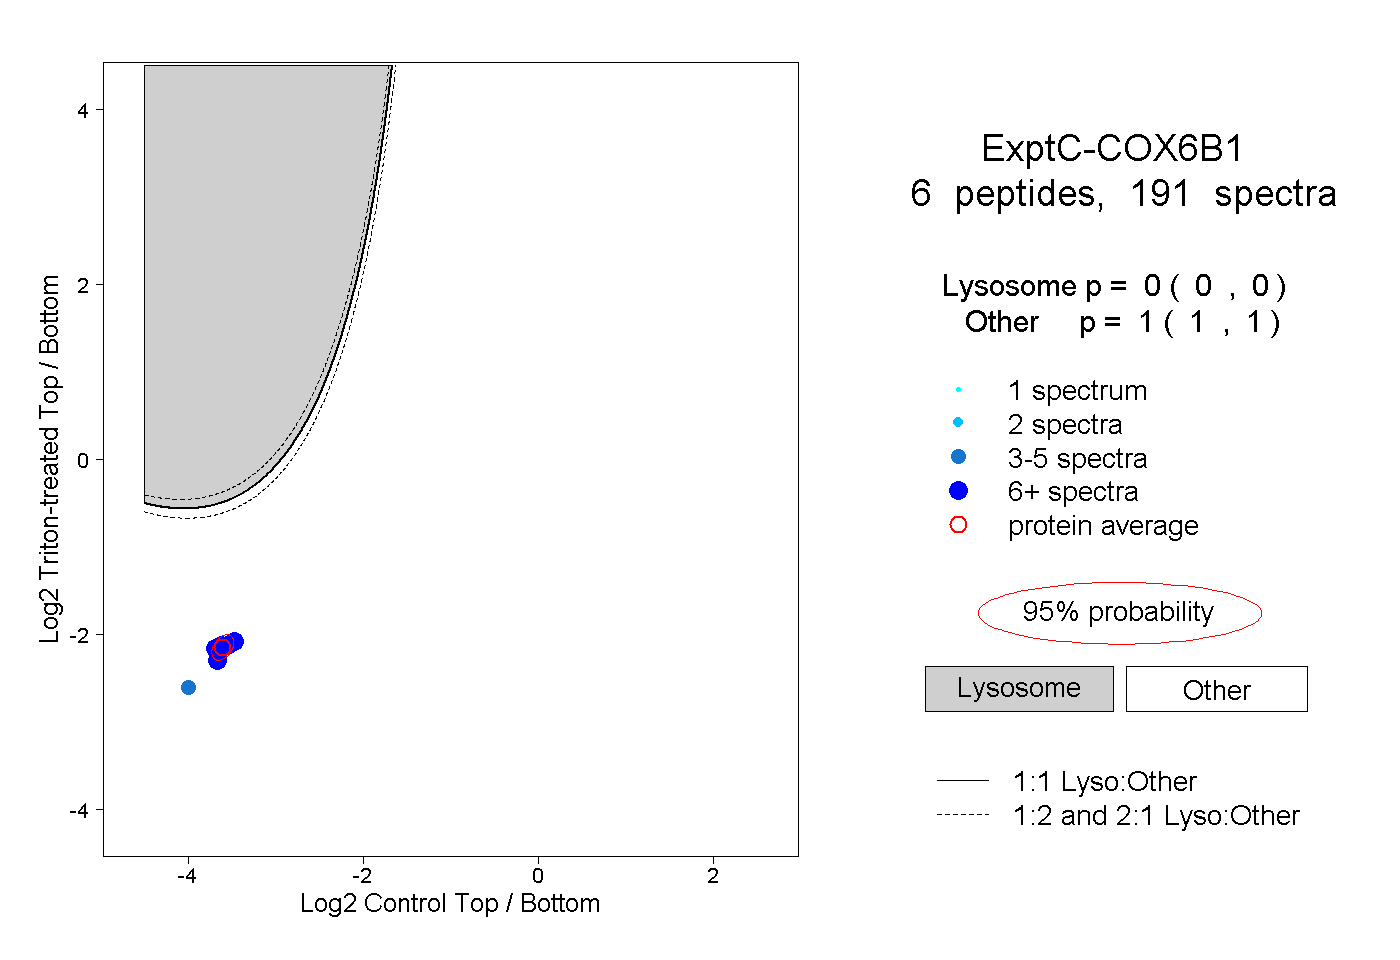 |
0.000 0.000 | 0.000 |
1.000 1.000 | 1.000 |
||||||||
| Plot | Lyso | Other | |||||||||||
| Expt D |
4 peptides |
11 spectra |
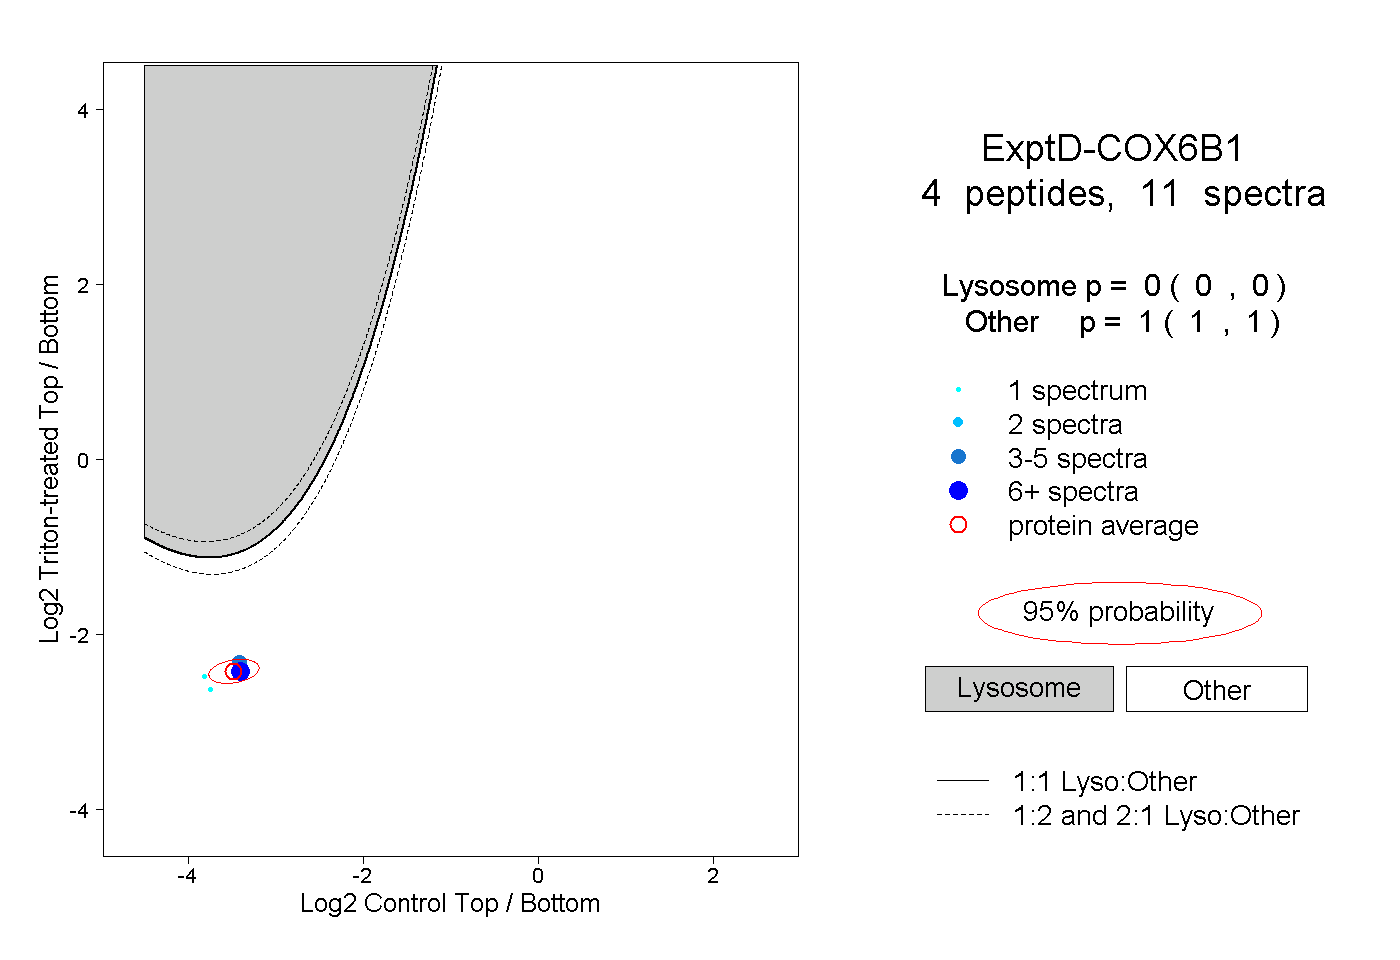 |
0.000 0.000 | 0.000 |
1.000 1.000 | 1.000 |