 1
1peptide
spectra
NA | NA
NA | NA
NA | NA
NA | NA
NA | NA
NA | NA
NA | NA
NA | NA
1peptide
spectra
0.683 | 0.998
0.002 | 0.317
| Plot | Mito | Lyso | Perox | ER | Golgi | PM | Cytosol | Nucleus | |||||
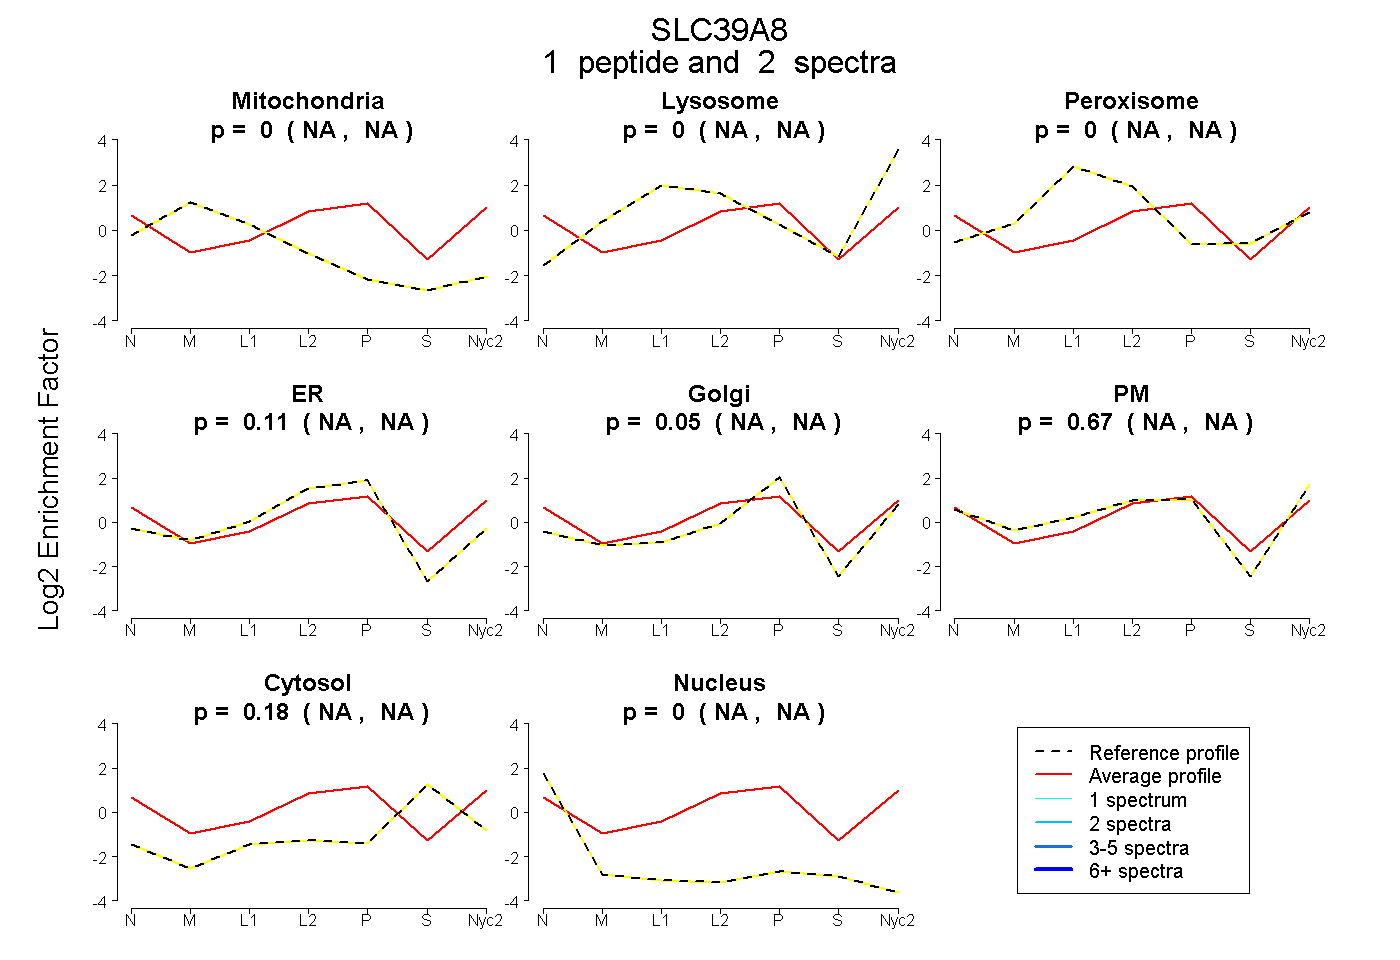
| Expt A |
1 peptide |
2 spectra |
|
0.000 NA | NA |
0.000 NA | NA |
0.000 NA | NA |
0.111 NA | NA |
0.048 NA | NA |
0.666 NA | NA |
0.175 NA | NA |
0.000 NA | NA |
||
| Plot | Lyso | Other | |||||||||||
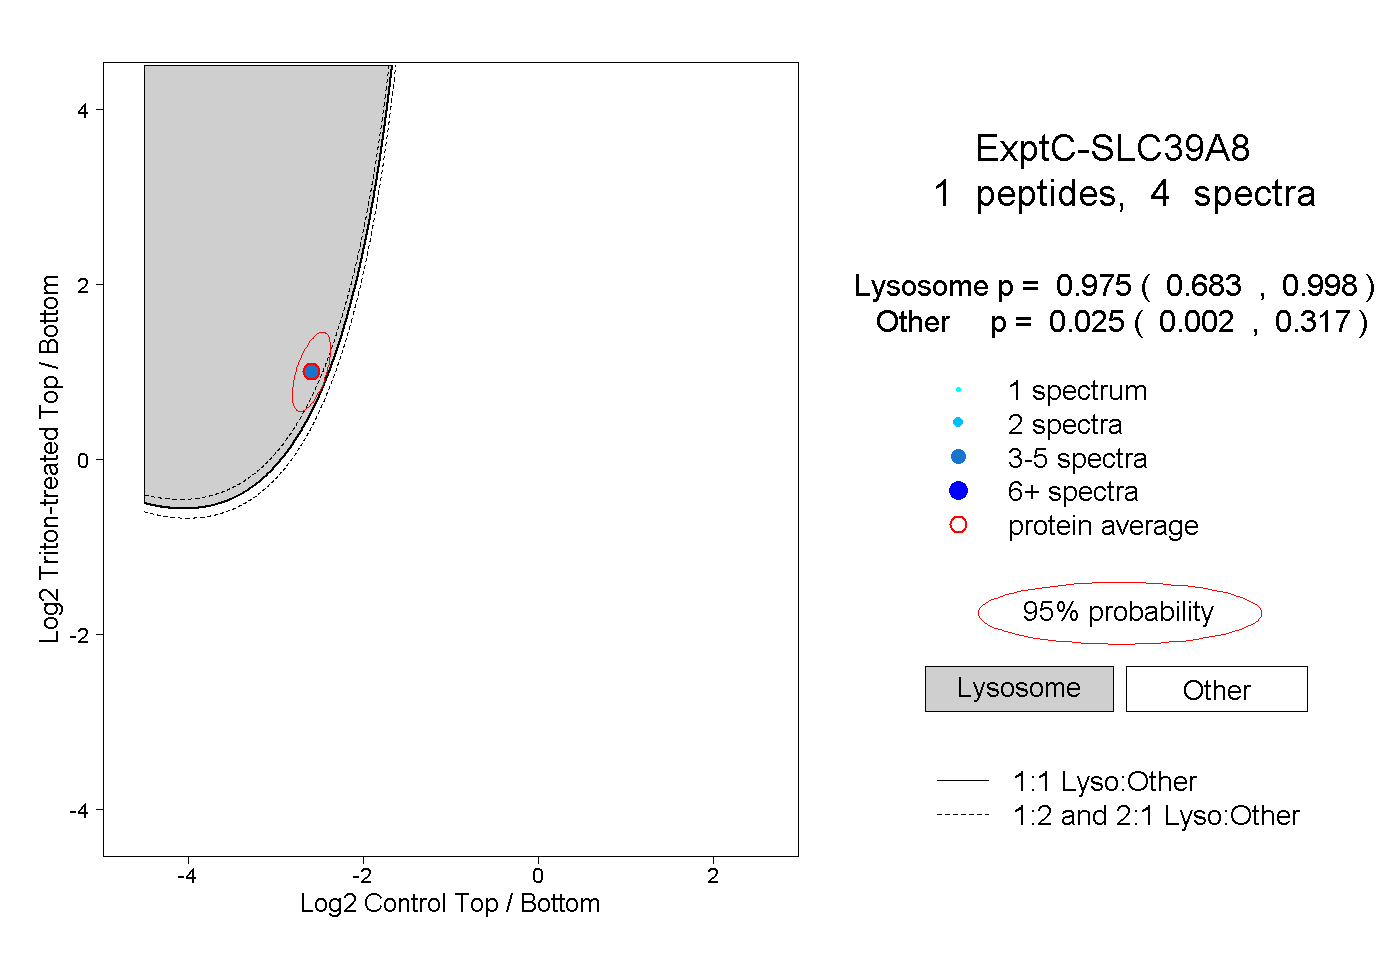
| Expt C |
1 peptide |
4 spectra |
|
0.975 0.683 | 0.998 |
0.025 0.002 | 0.317 |