 32
32peptides
spectra
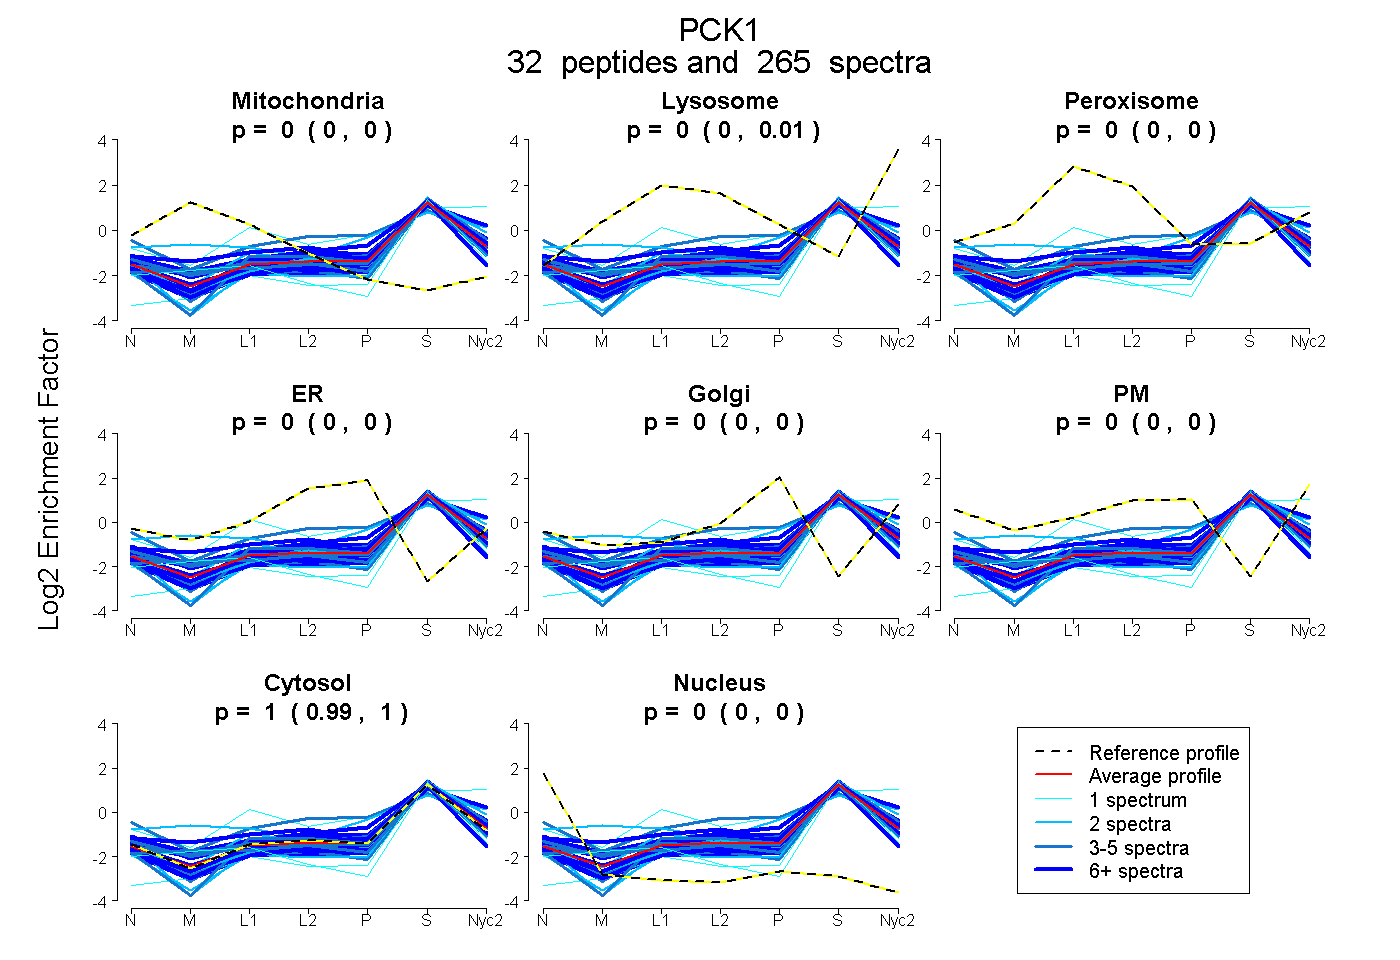
0.000 | 0.000
0.003 | 0.006
0.000 | 0.000
0.000 | 0.000
0.000 | 0.000
0.000 | 0.000
0.994 | 0.996
0.000 | 0.000
15peptides
spectra
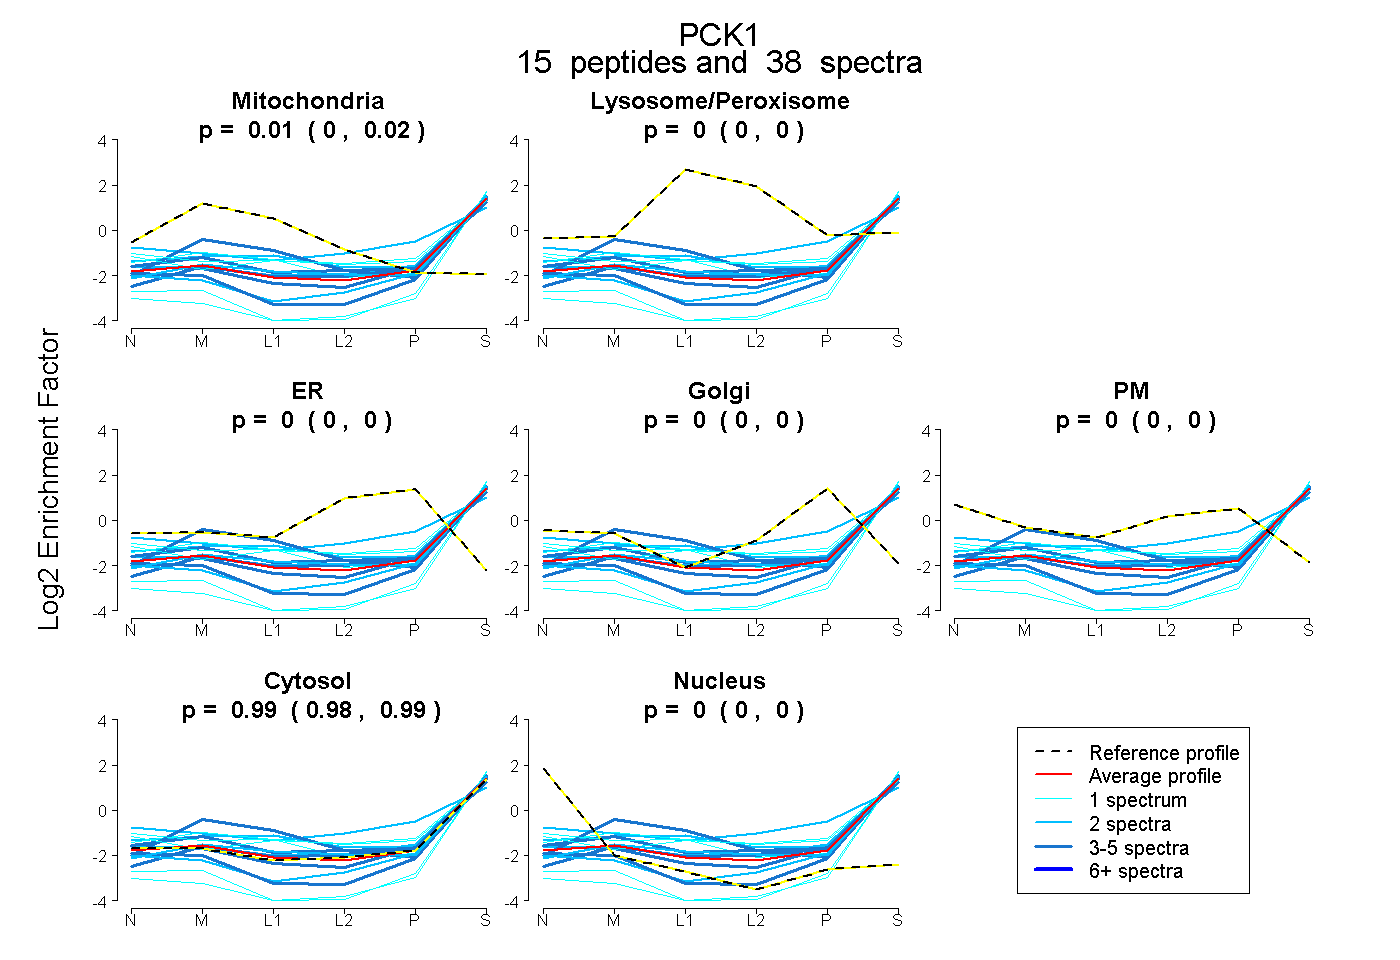
0.005 | 0.023
0.000 | 0.000
0.000 | 0.000
0.000 | 0.000
0.000 | 0.000
0.975 | 0.993
0.000 | 0.000
26peptides
spectra
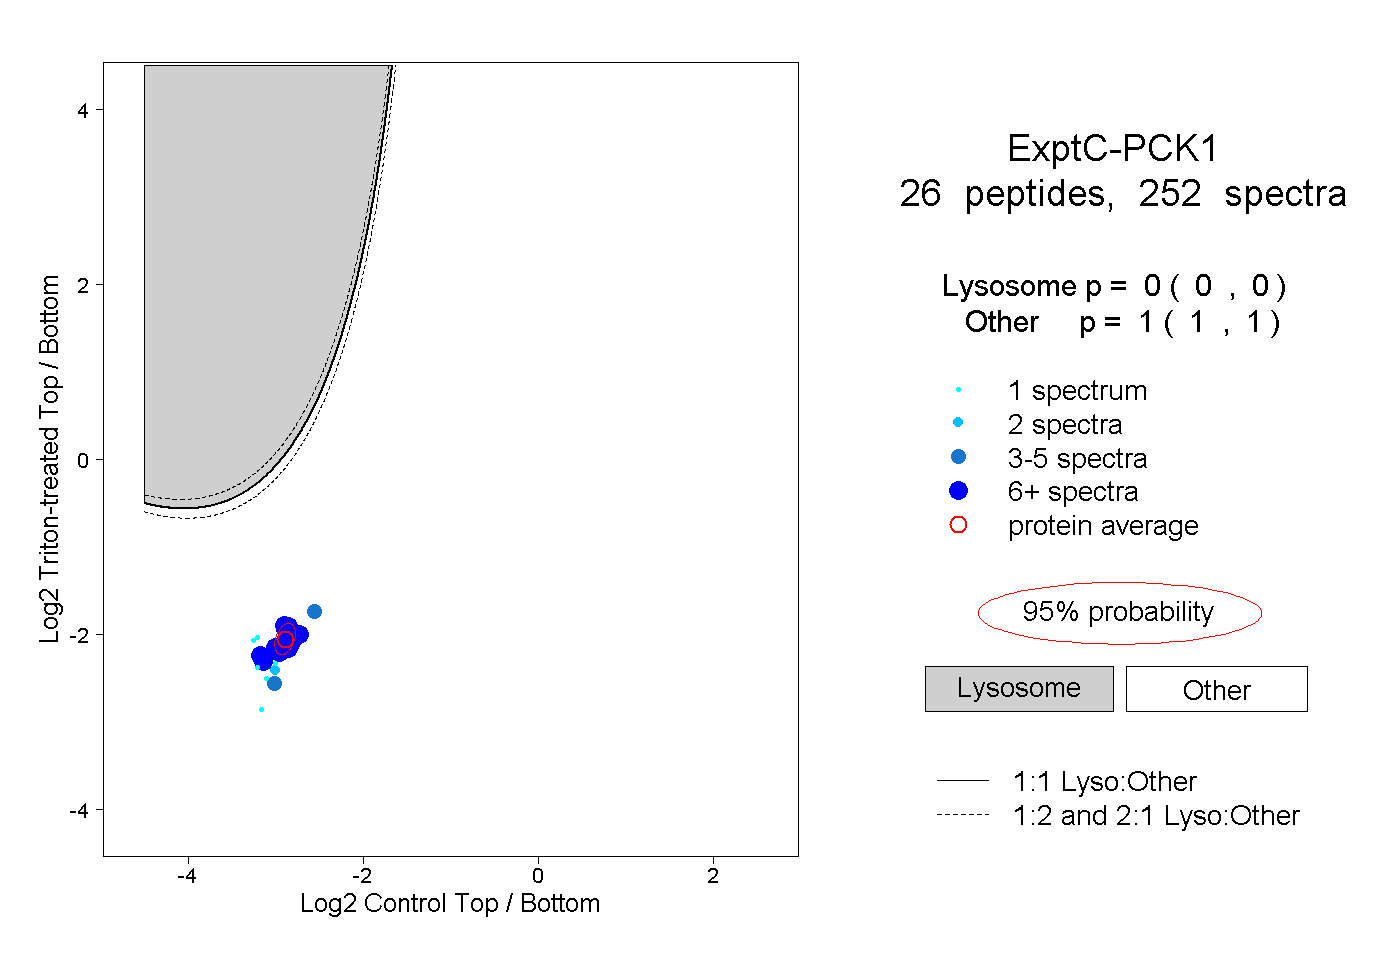
0.000 | 0.000
1.000 | 1.000
7peptides
spectra
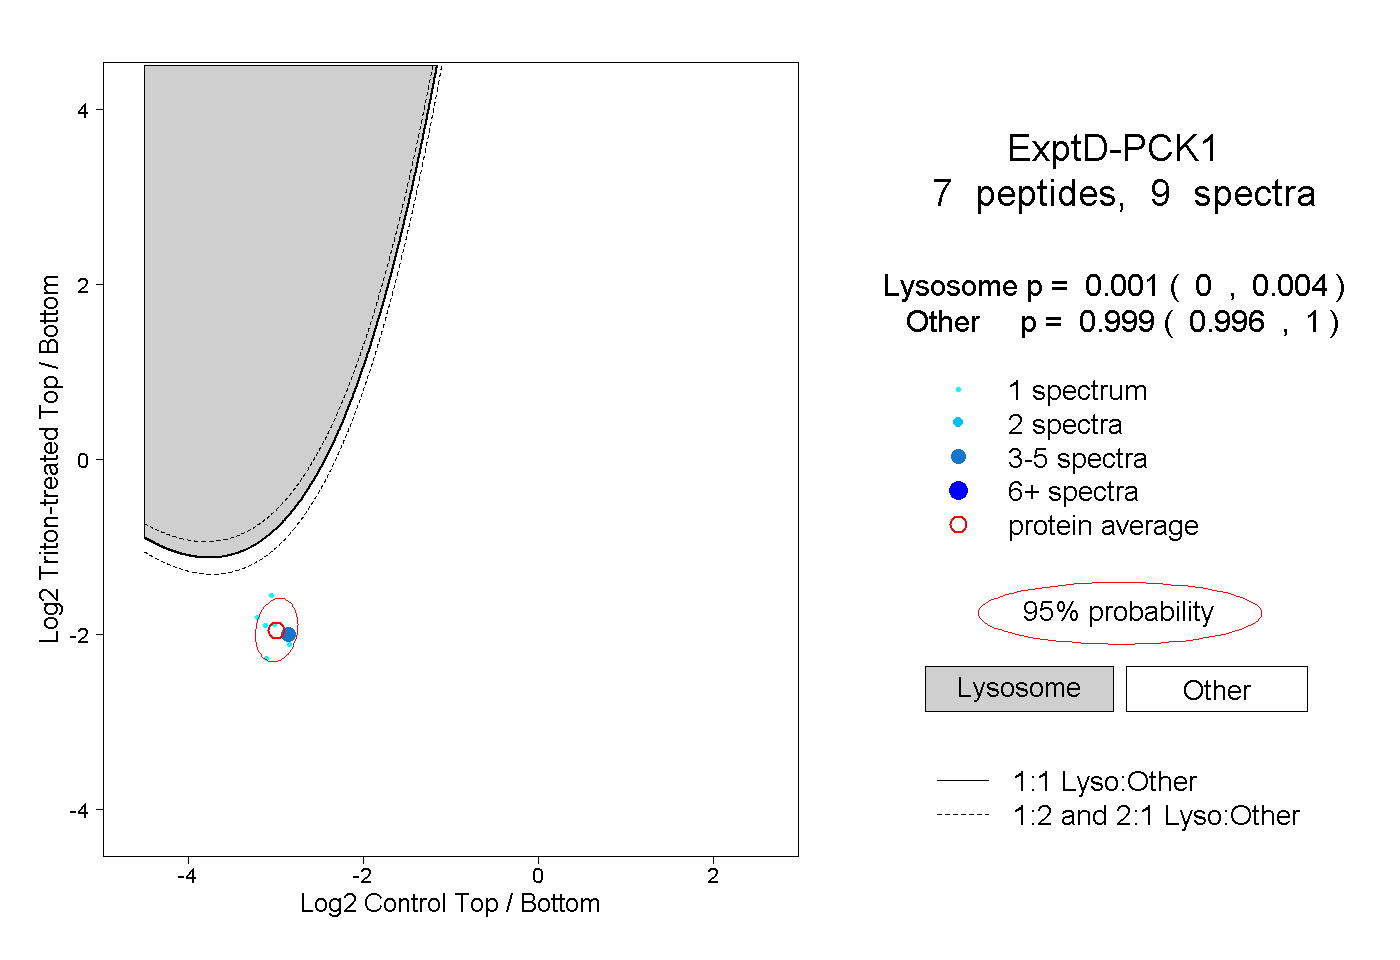
0.000 | 0.004
0.996 | 1.000