 3
3peptides
spectra
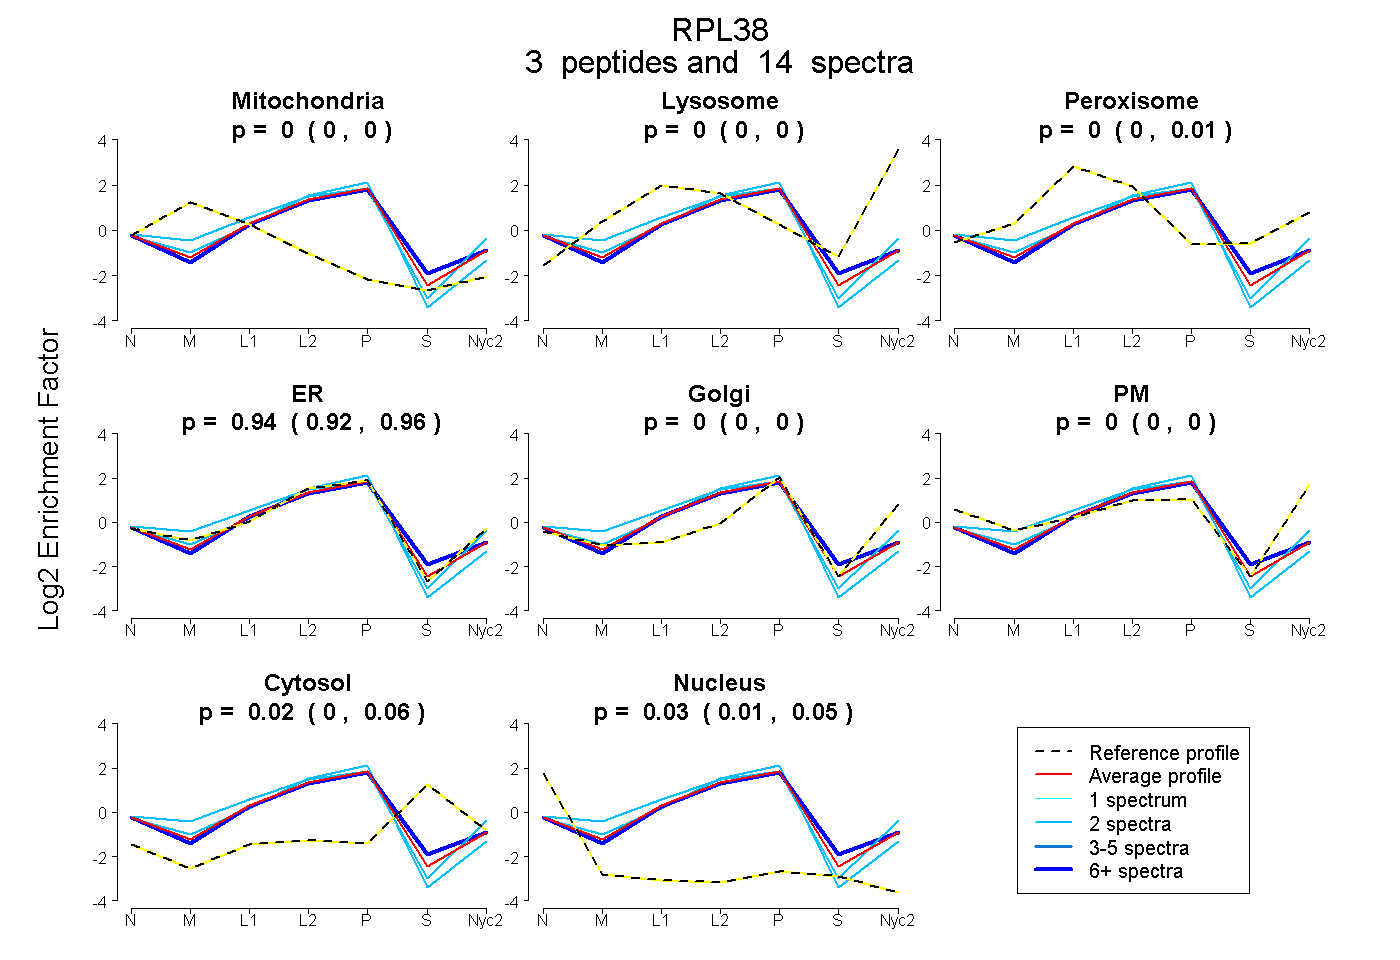
0.000 | 0.000
0.000 | 0.000
0.000 | 0.013
0.916 | 0.958
0.000 | 0.000
0.000 | 0.000
0.000 | 0.057
0.008 | 0.054
1peptide
spectra
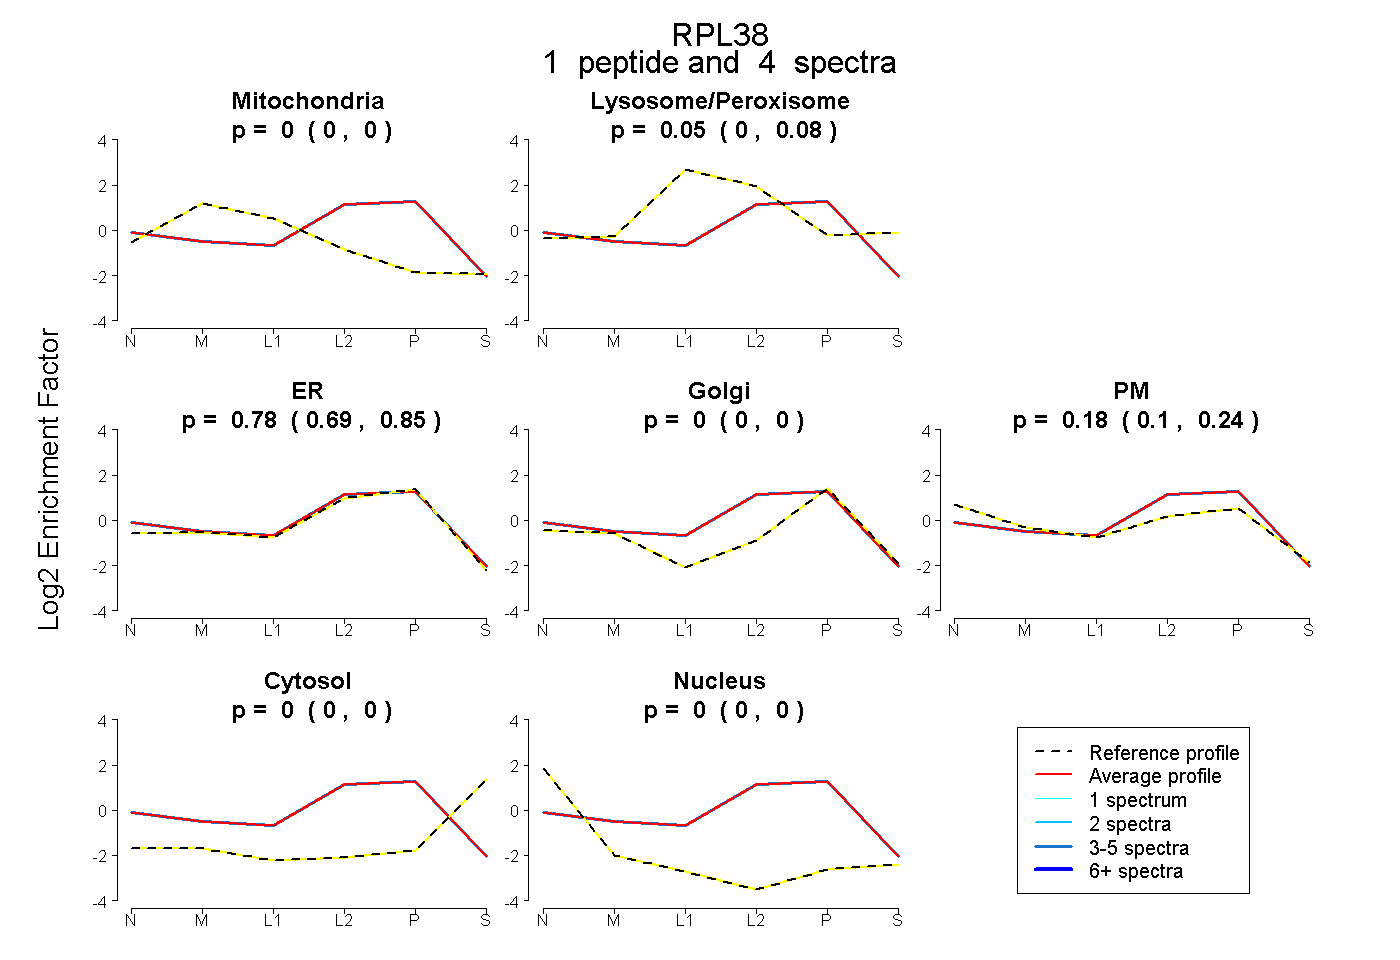
0.000 | 0.000
0.000 | 0.082
0.688 | 0.854
0.000 | 0.000
0.099 | 0.240
0.000 | 0.000
0.000 | 0.000
3peptides
spectra
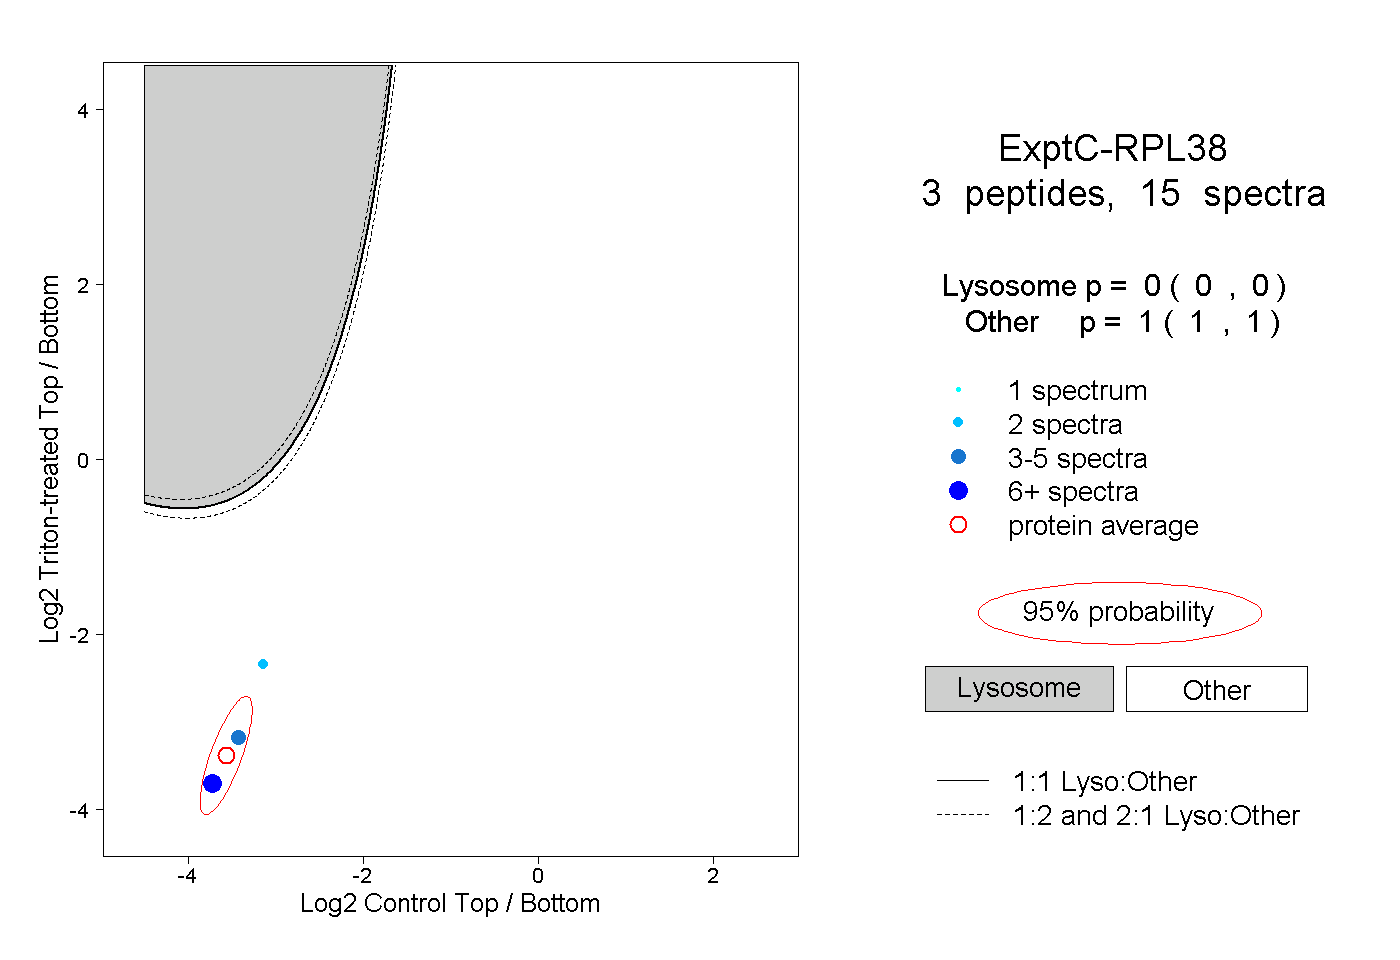
0.000 | 0.000
1.000 | 1.000
1peptide
spectra
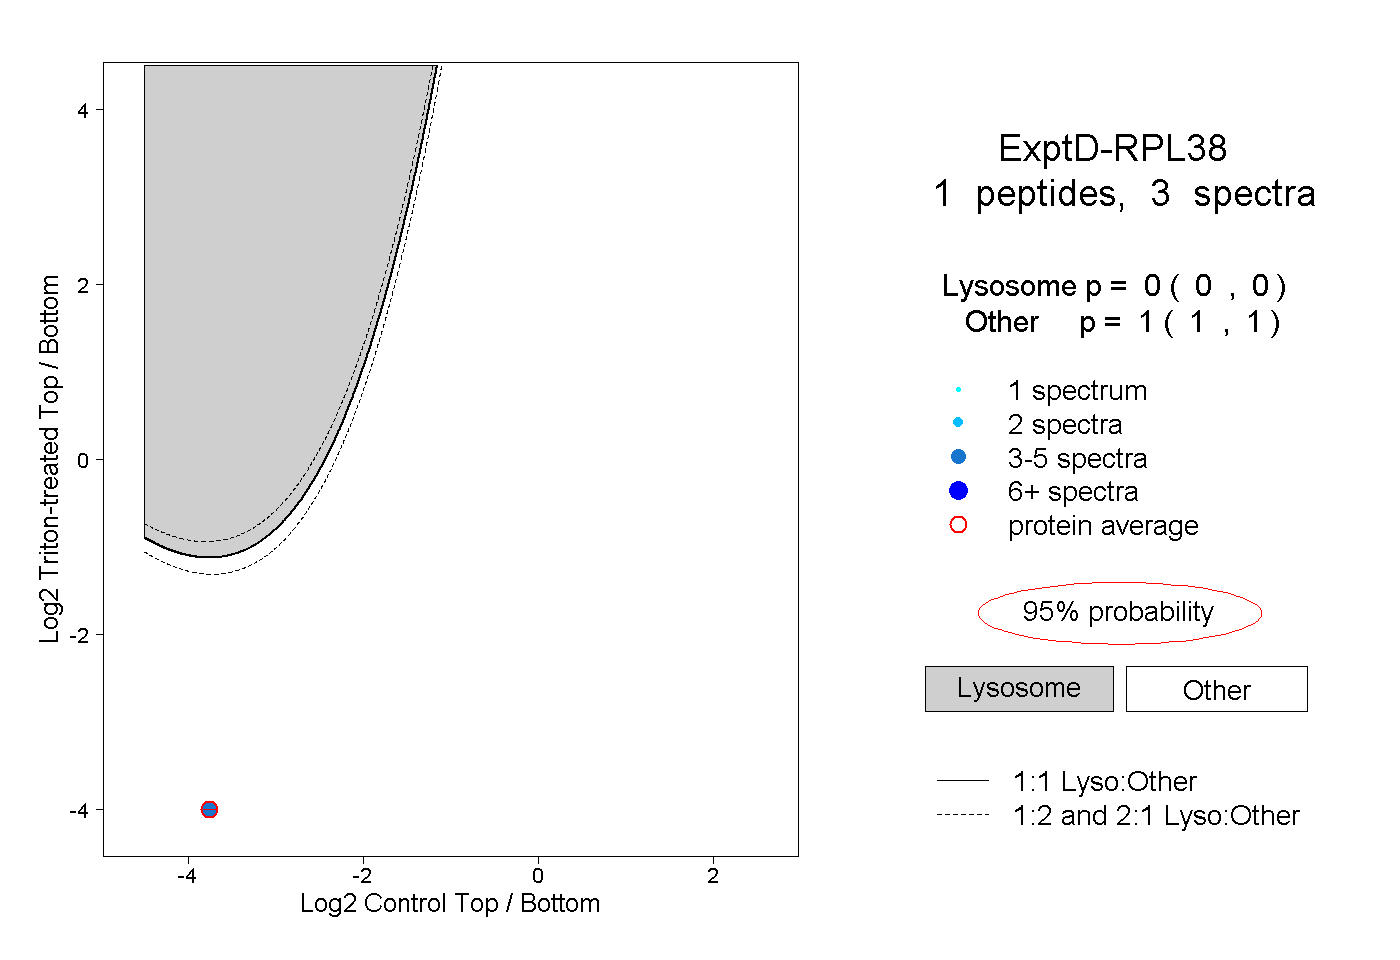
0.000 | 0.000
1.000 | 1.000