 1
1peptide
spectrum
NA | NA
NA | NA
NA | NA
NA | NA
NA | NA
NA | NA
NA | NA
NA | NA
10peptides
spectra
0.000 | 0.649
0.325 | 1.000
| Plot | Mito | Lyso | Perox | ER | Golgi | PM | Cytosol | Nucleus | |||||
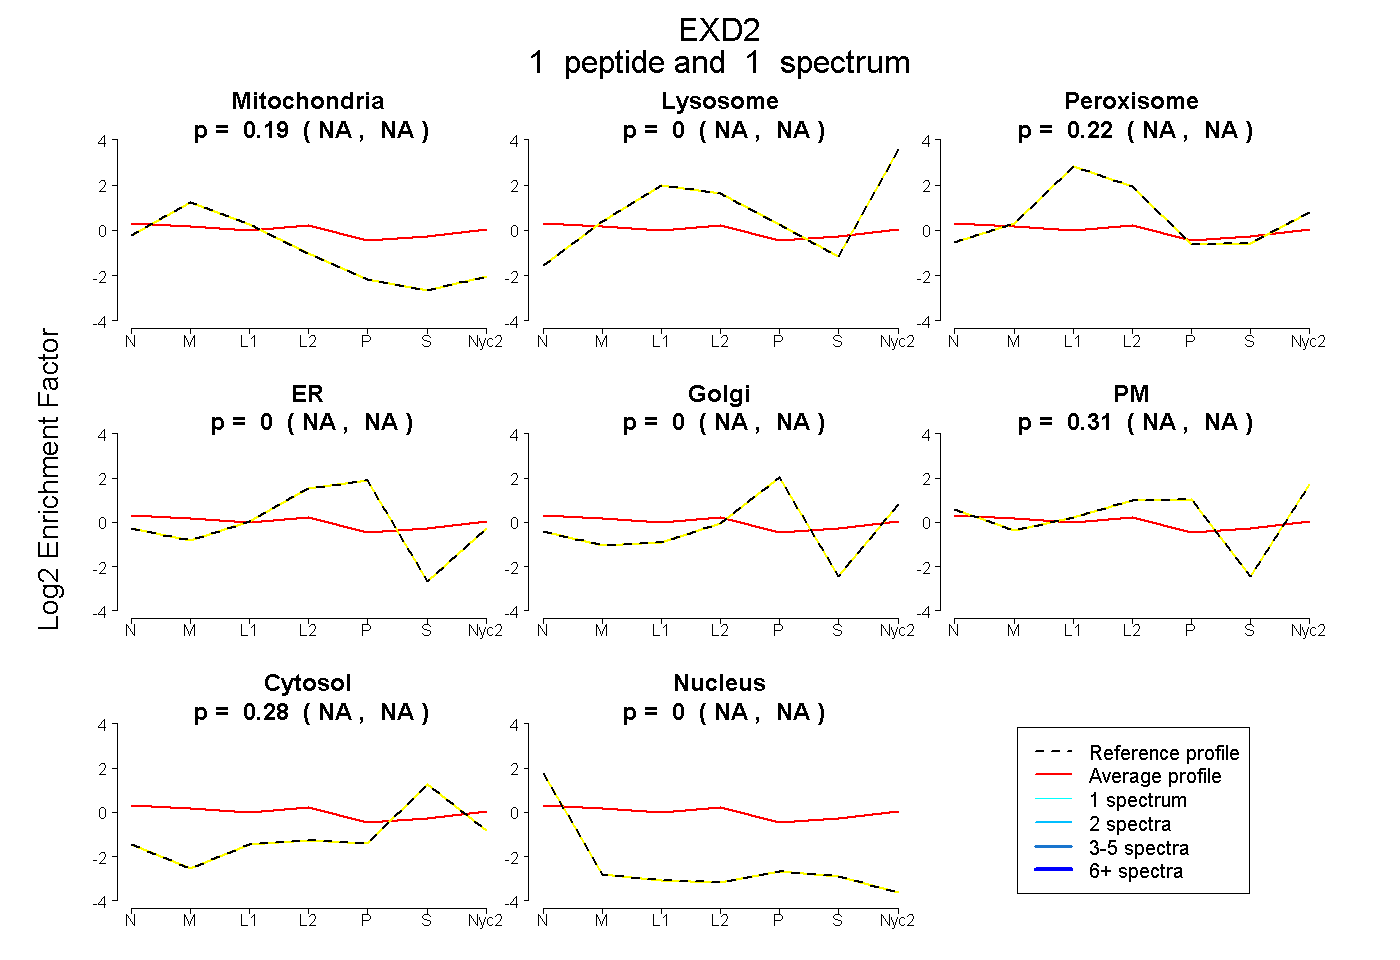
| Expt A |
1 peptide |
1 spectrum |
|
0.189 NA | NA |
0.000 NA | NA |
0.223 NA | NA |
0.000 NA | NA |
0.000 NA | NA |
0.305 NA | NA |
0.283 NA | NA |
0.000 NA | NA |
||
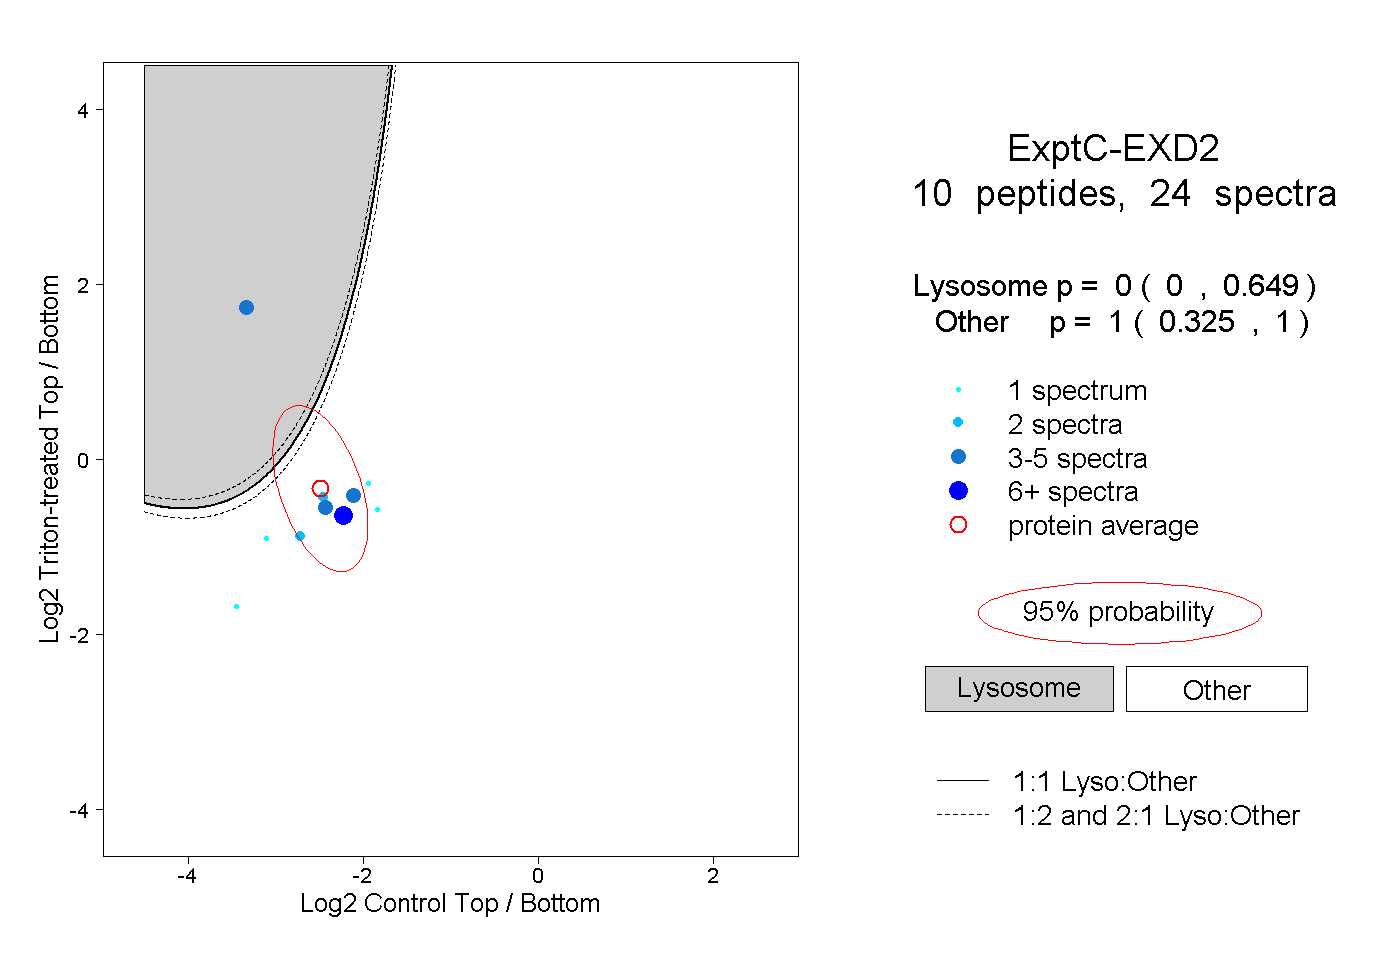
| Plot | Lyso | Other | |||||||||||
| Expt C |
10 peptides |
24 spectra |
|
0.000 0.000 | 0.649 |
1.000 0.325 | 1.000 |