 3
3peptides
spectra
0.000 | 0.000
0.000 | 0.000
0.058 | 0.089
0.000 | 0.000
0.000 | 0.000
0.605 | 0.654
0.282 | 0.306
0.000 | 0.000
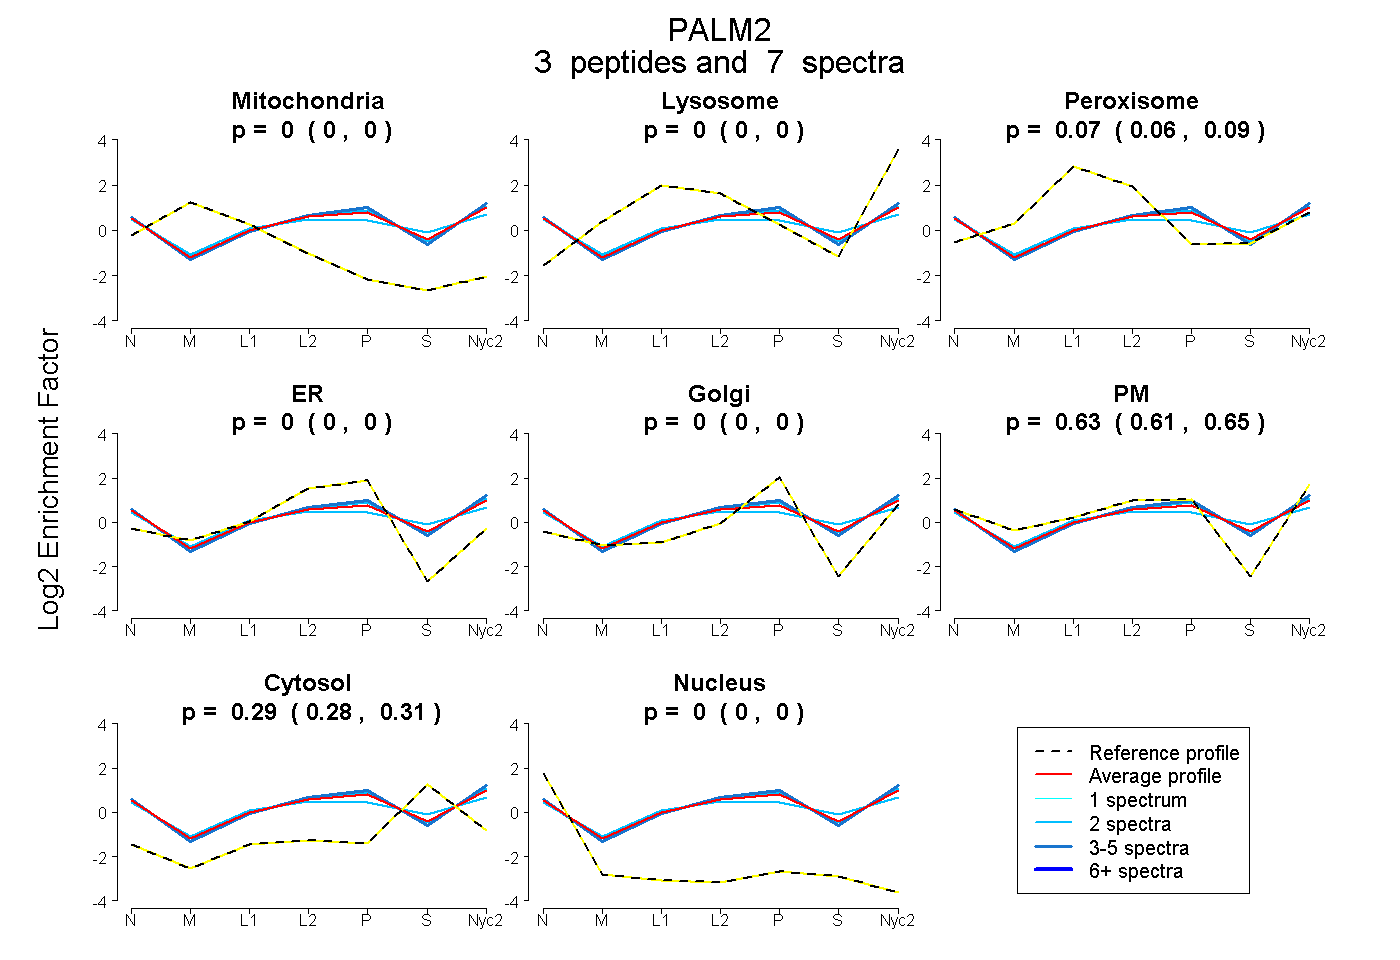
| Plot | Mito | Lyso | Perox | ER | Golgi | PM | Cytosol | Nucleus | |||||
| Expt A |
3 peptides |
7 spectra |
|
0.000 0.000 | 0.000 |
0.000 0.000 | 0.000 |
0.074 0.058 | 0.089 |
0.000 0.000 | 0.000 |
0.000 0.000 | 0.000 |
0.631 0.605 | 0.654 |
0.294 0.282 | 0.306 |
0.000 0.000 | 0.000 |
| 2 spectra, TVVADGSLGHPK | 0.000 | 0.000 | 0.154 | 0.000 | 0.000 | 0.499 | 0.347 | 0.000 | ||
| 2 spectra, AGQSSFR | 0.000 | 0.000 | 0.050 | 0.000 | 0.000 | 0.668 | 0.281 | 0.000 | ||
| 3 spectra, DVEELIQK | 0.000 | 0.000 | 0.029 | 0.000 | 0.000 | 0.711 | 0.260 | 0.000 |
| Plot | Mito | Lyso or Perox | ER | Golgi | PM | Cytosol | Nucleus | ||||||
| Expt B |
2 peptides |
3 spectra |
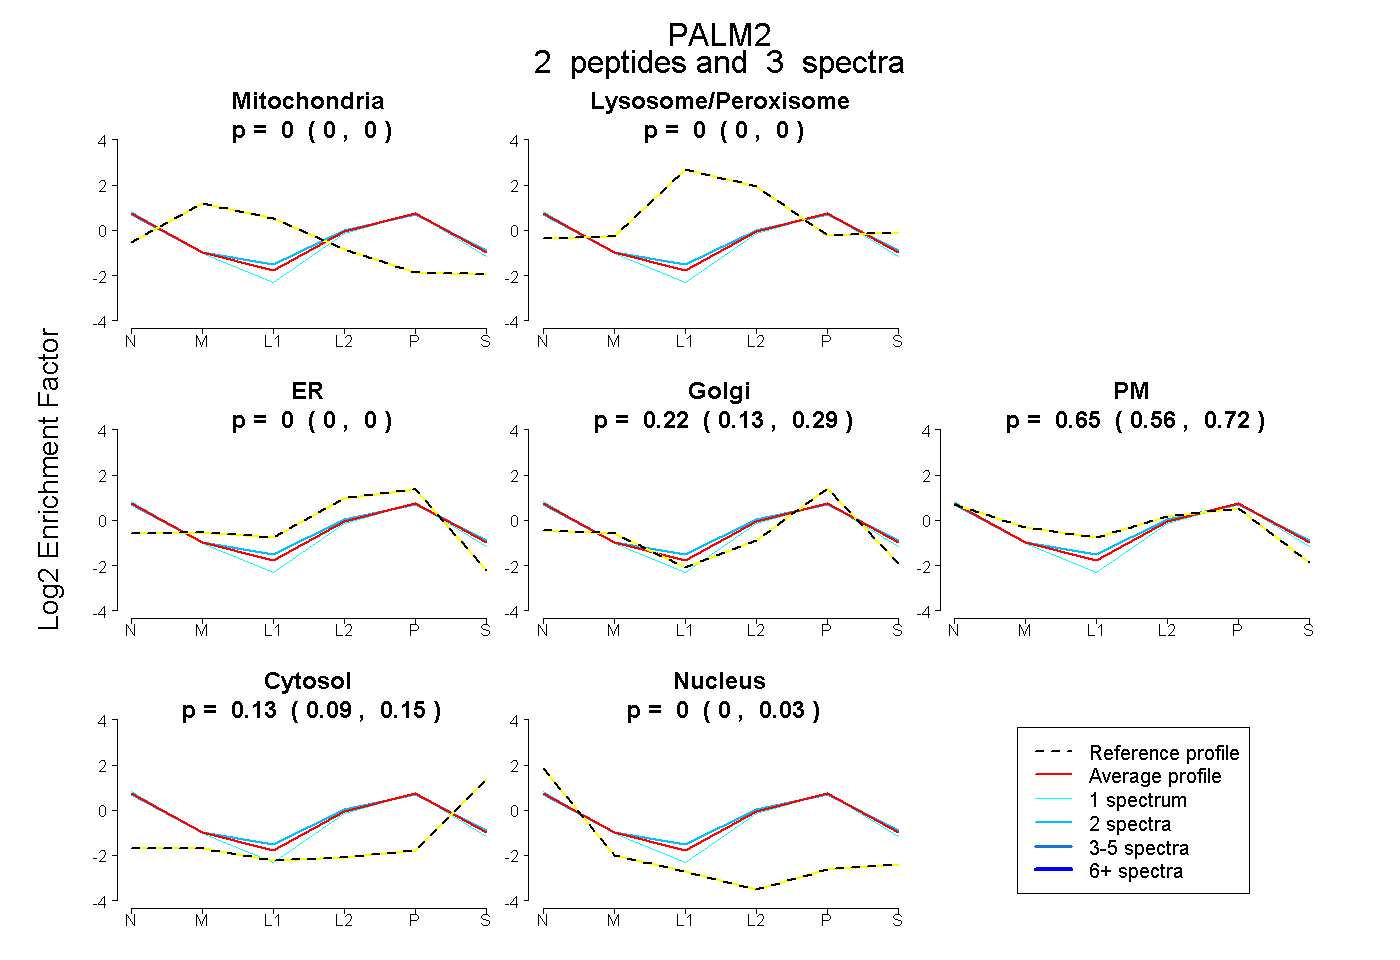 |
0.000 0.000 | 0.000 |
0.000 0.000 | 0.000 |
0.000 0.000 | 0.000 |
0.220 0.133 | 0.291 |
0.649 0.560 | 0.720 |
0.129 0.088 | 0.152 |
0.002 0.000 | 0.026 |
|||
| Plot | Lyso | Other | |||||||||||
| Expt C |
5 peptides |
11 spectra |
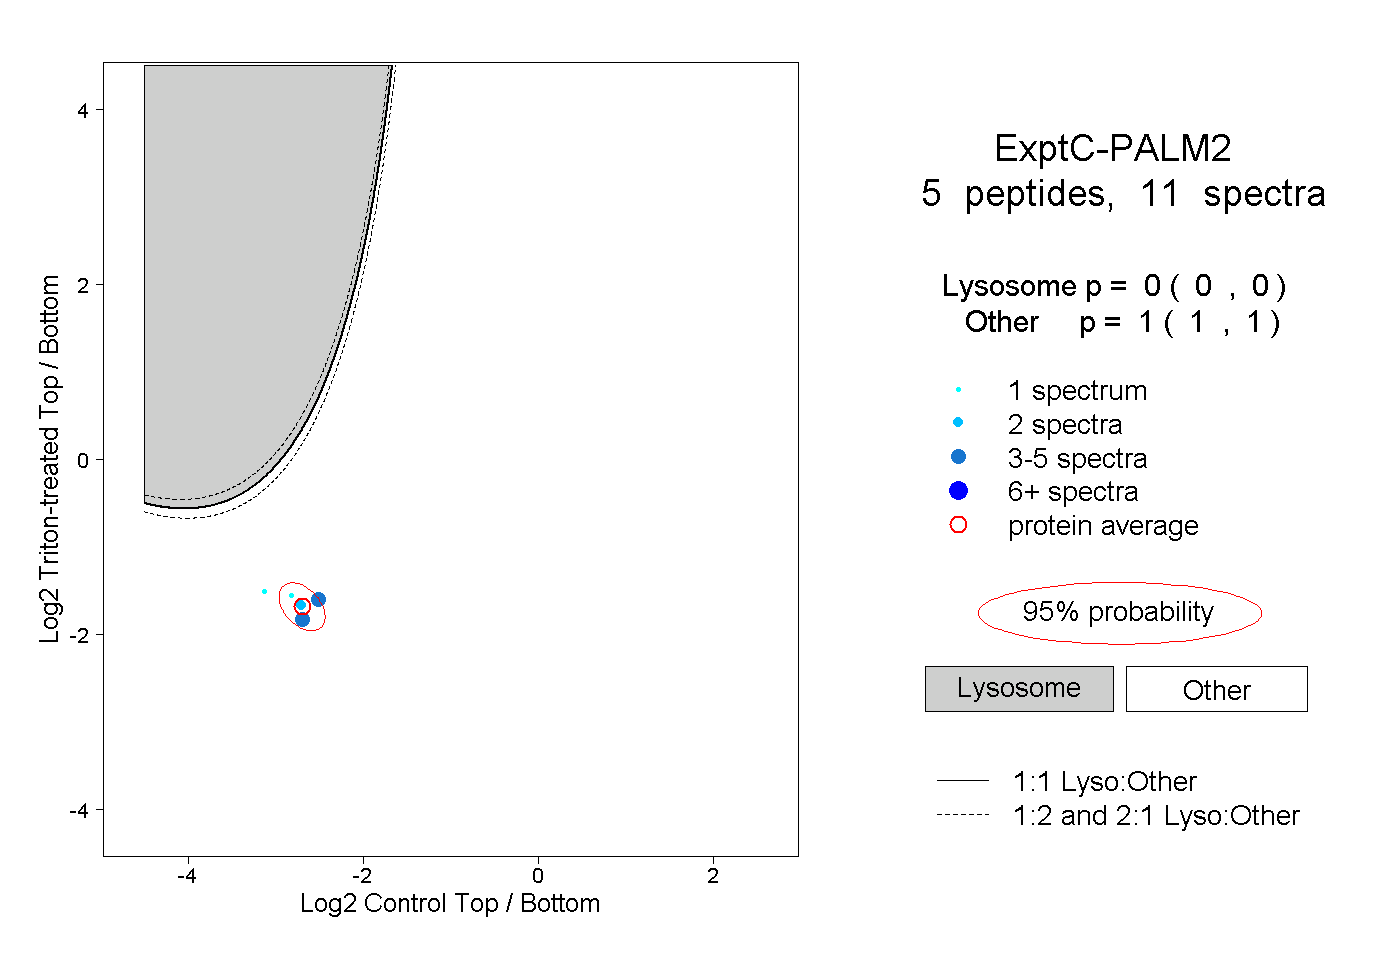 |
0.000 0.000 | 0.000 |
1.000 1.000 | 1.000 |
||||||||
| Plot | Lyso | Other | |||||||||||
| Expt D |
1 peptide |
1 spectrum |
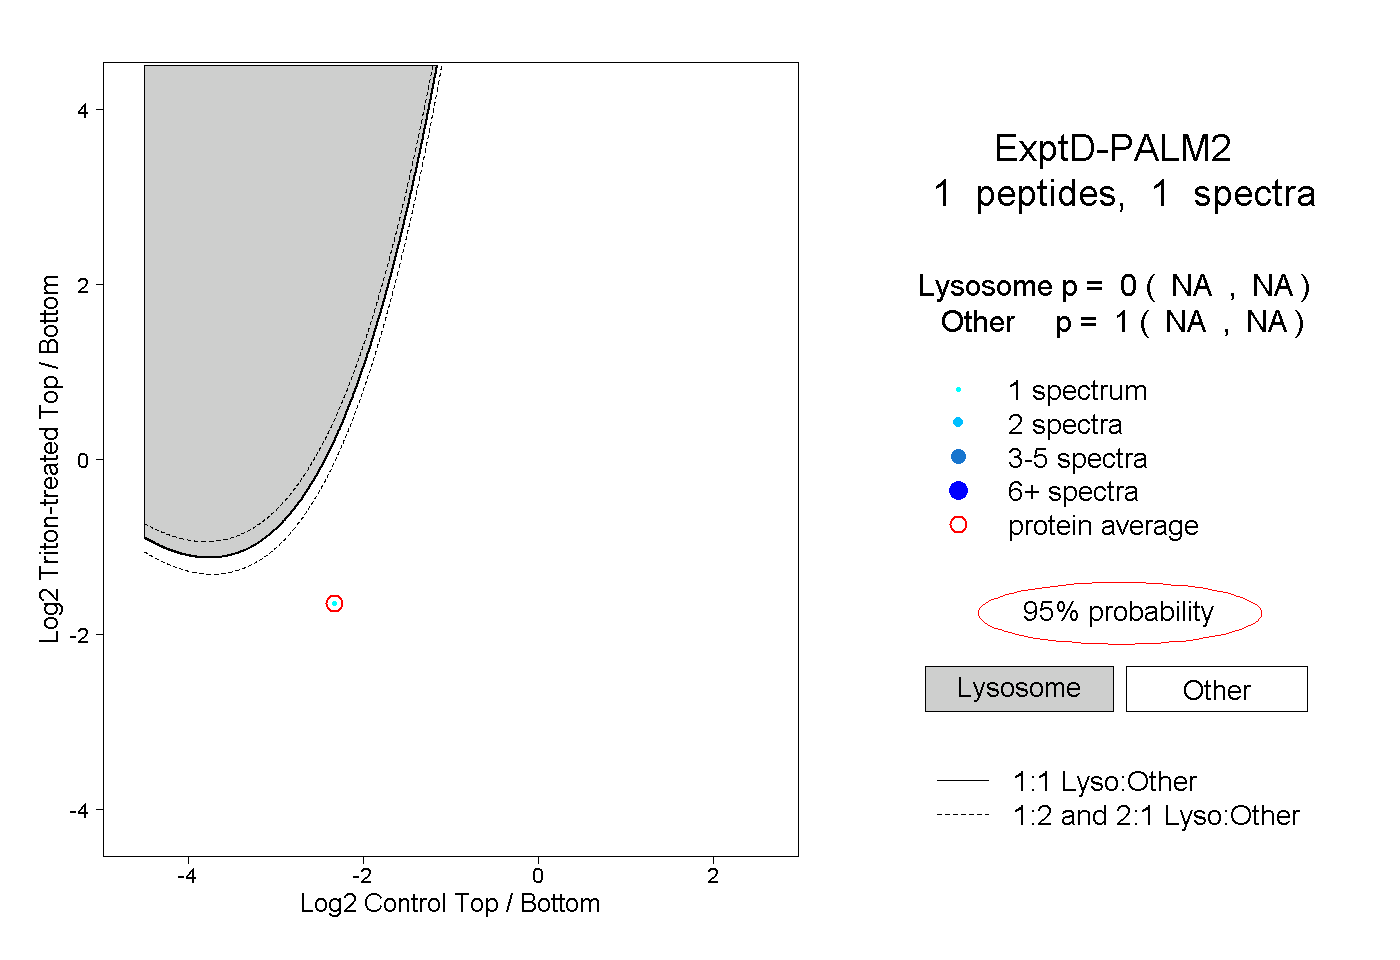 |
0.000 NA | NA |
1.000 NA | NA |