 13
13peptides
spectra
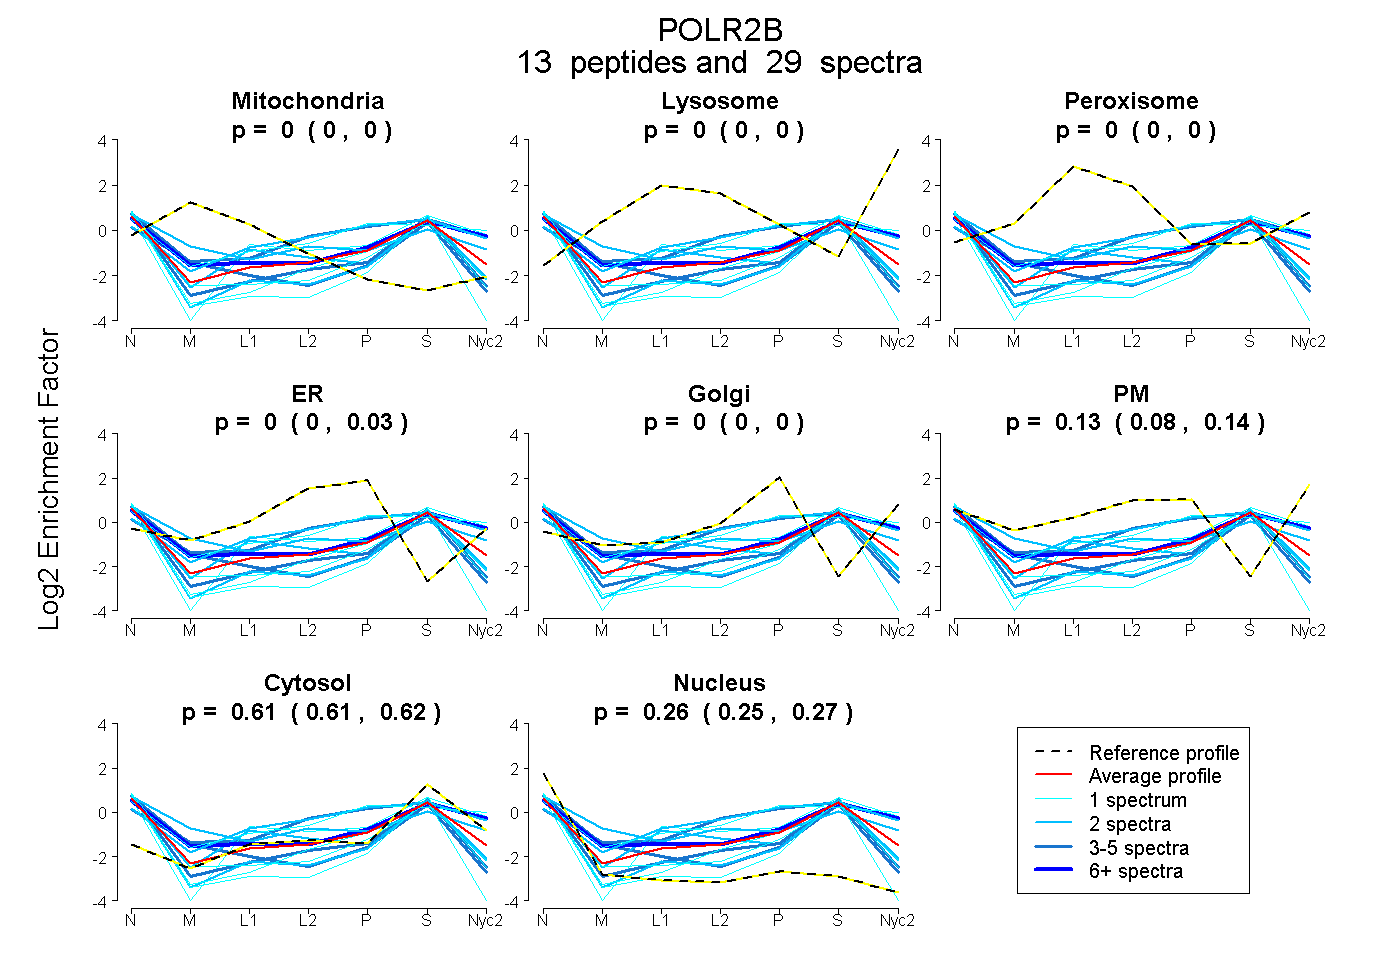
0.000 | 0.000
0.000 | 0.000
0.000 | 0.003
0.000 | 0.033
0.000 | 0.000
0.085 | 0.137
0.606 | 0.618
0.248 | 0.269
2peptides
spectra
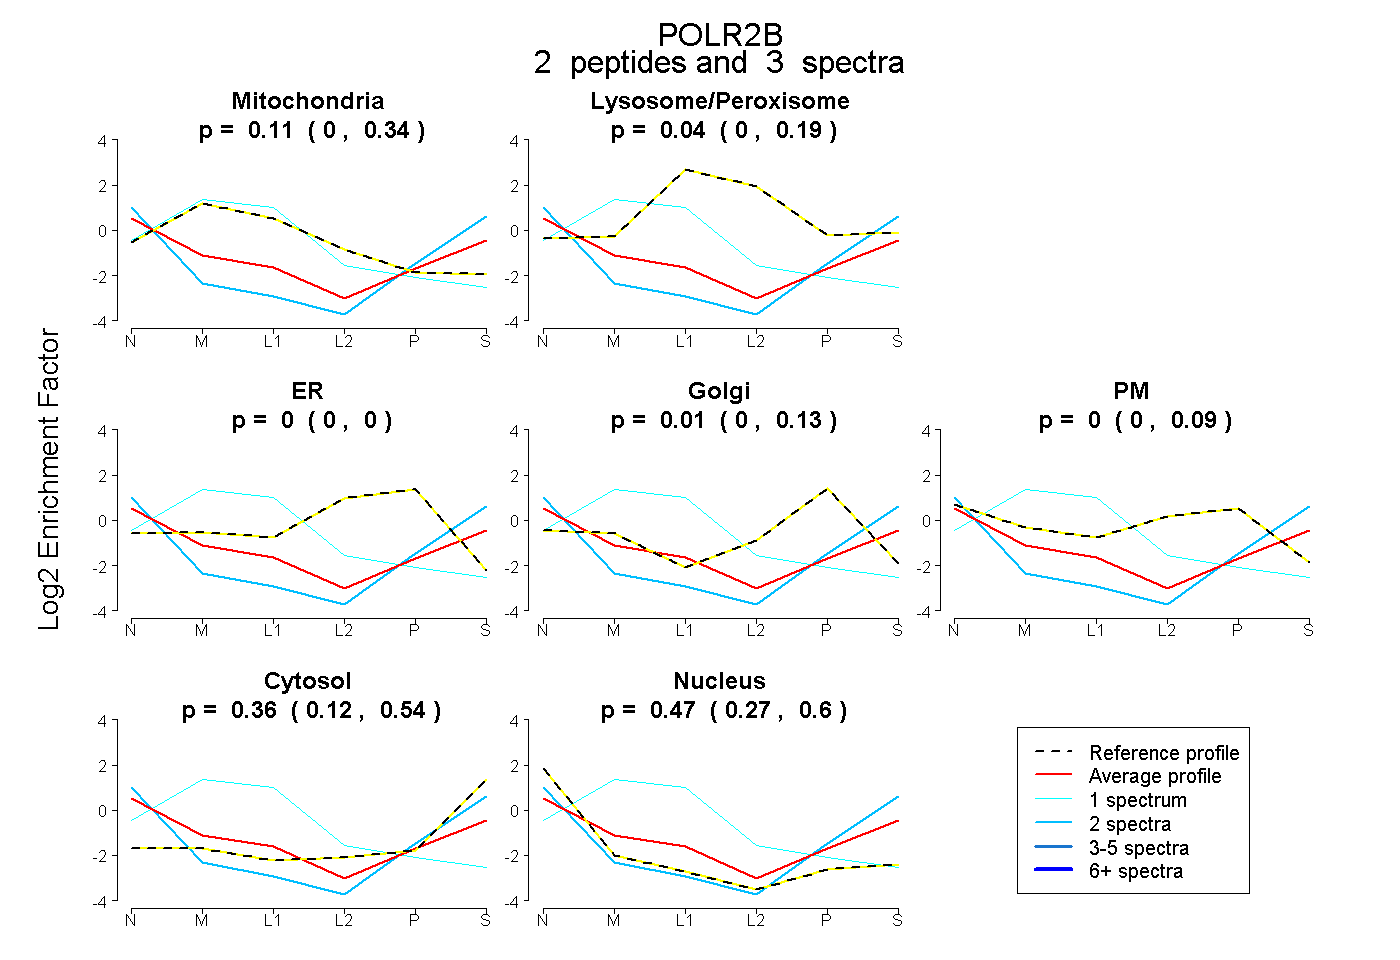
0.000 | 0.342
0.000 | 0.195
0.000 | 0.000
0.000 | 0.126
0.000 | 0.088
0.122 | 0.542
0.273 | 0.601