 2
2peptides
spectra
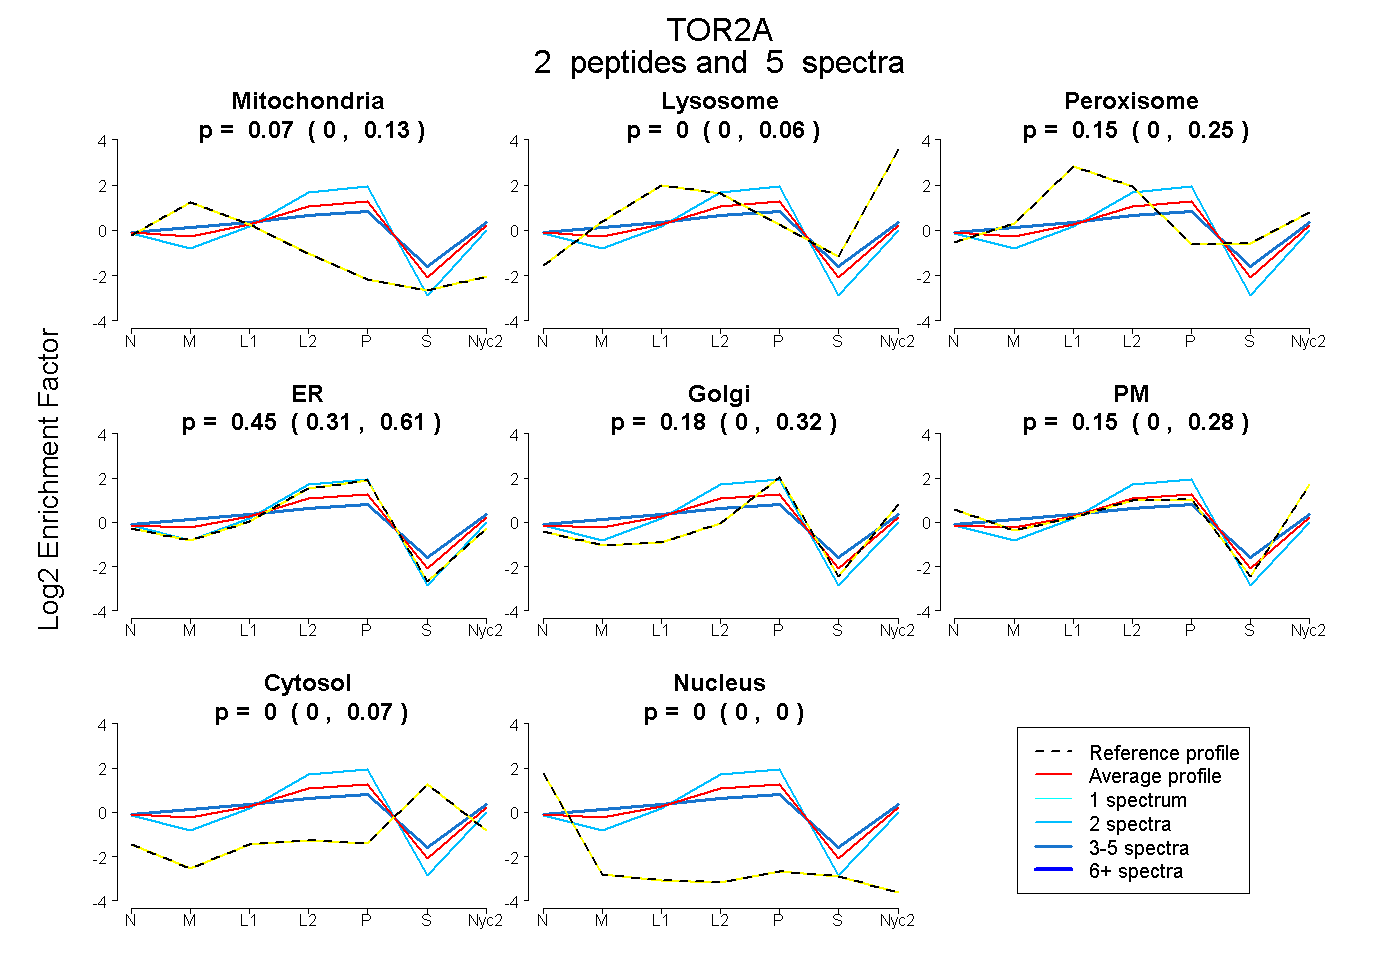
0.000 | 0.133
0.000 | 0.060
0.000 | 0.252
0.308 | 0.611
0.000 | 0.321
0.000 | 0.276
0.000 | 0.069
0.000 | 0.000
1peptide
spectrum
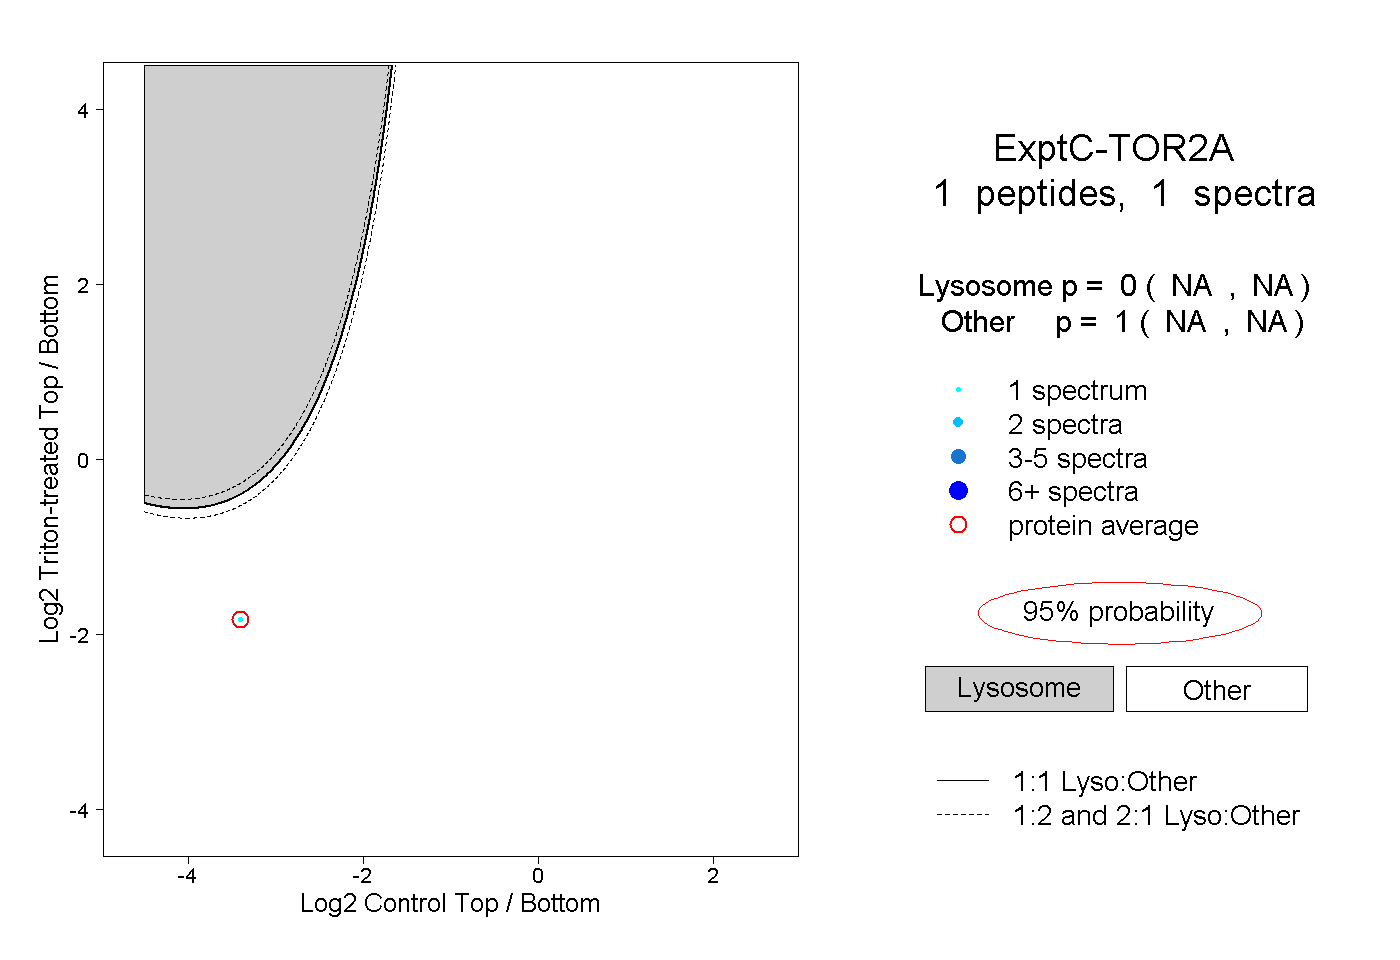
NA | NA
NA | NA
1peptide
spectrum
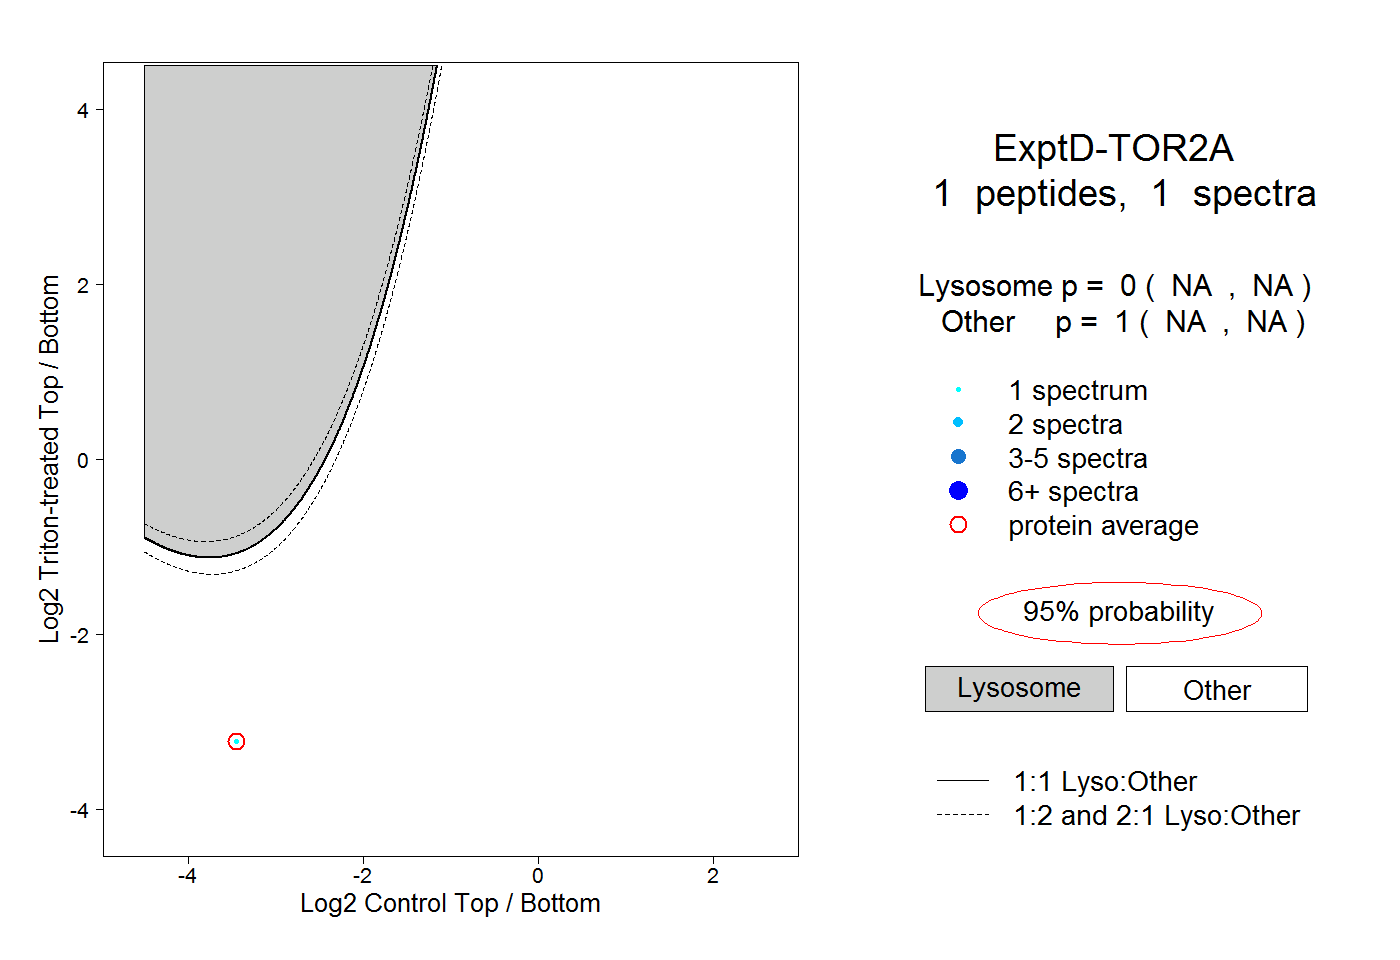
NA | NA
NA | NA